Welding monitoring system ROI is the number that converts a technology proposal into a budget line — and it is the question every quality manager and plant director faces before capital approval. Getting the calculation right requires knowing your current cost of weld defects, your projected savings from early detection, and the payback period that finance will accept.
This guide gives you the formula, the data inputs, and the business case structure to make the justification credible and approved.
Key takeaways
- Welding monitoring system ROI = (annual savings − system cost) / system cost × 100. Payback on multi-shift production lines typically falls between 6 and 18 months.
- Your ROI baseline is your current cost of poor weld quality: rework labour, scrap material, NDT staff time, and warranty claims — expressed as an annual total from ERP actuals.
- A 30–60% reduction in defect escape rate is a conservative and well-documented range for real-time thermal and vision monitoring systems.
- Non-financial returns — ISO 3834 parameter documentation, traceability records, audit readiness — have measurable value but are easier to quantify after the financial case is approved.
- The business case structure that clears finance: baseline cost → projected savings → investment as 3-year TCO → risk-adjusted payback under a 20%-savings-miss scenario.
- Use station-level metrics (defects per 1,000 welds at station 3) not plant averages — line-level specificity makes the argument concrete and hard to dismiss.
- Present conservative estimates: 30% saving in the CFO deck, 60% in the engineering appendix. Conservative numbers improve credibility with finance.
Table of Contents
- The Cost of Weld Defects: Building Your ROI Baseline
- The Welding Monitoring System ROI Formula
- Break-Even Analysis: What Payback Looks Like in Practice
- Non-Financial Returns You Can Quantify
- Building the Business Case for Management
- Tracking ROI After Deployment
- FAQ
The Cost of Weld Defects: Building Your ROI Baseline
Before calculating return, you need the denominator — and most plants underestimate it because defect cost is distributed across departments. Quality pays for inspection, production books rework hours, and finance records warranty claims on a separate cost centre. The total is rarely visible in a single report.
Direct cost categories per weld defect:
| Cost category | Typical range (€ per defect event) |
|---|---|
| Manual rework — grinding, re-welding, re-inspection | 150 – 800 |
| Scrap — material cost plus machining or fabrication lost | 200 – 2,000+ |
| Post-weld NDT re-test — radiography, UT repeat | 50 – 300 |
| NCR documentation and disposition | 30 – 100 |
| Field warranty claim (attributed to weld quality) | 500 – 20,000+ |
Research from TWI — The Welding Institute estimates total weld defect cost at 5–12% of welding production cost in facilities that rely on post-weld inspection alone. For a plant spending €2,000,000 per year on welding production, that is €100,000–€240,000 in avoidable annual loss.
How to collect your baseline data:
- Pull rework labour hours from production or maintenance logs (last 12 months).
- Apply your fully-loaded hourly rate including overhead (typically €45–€80/hr for EU manufacturing).
- Add scrap material cost from ERP — filter by nonconformance reason code where possible.
- Add NDT labour hours: visual inspection rounds, radiographic re-tests, ultrasonic re-scans.
- Add warranty claims attributable to weld quality from the service or after-sales department.
This total is your Annual Cost of Poor Weld Quality (COPQ). It is the number your welding monitoring system will systematically reduce.
The ISO 9001:2015 cost-of-quality framework — separating prevention, appraisal, and internal/external failure costs — gives this data collection a structure that finance already recognises. Use it when presenting the baseline: it signals methodological rigour and speeds CFO sign-off.
The Welding Monitoring System ROI Formula
Once you have the COPQ baseline, the ROI calculation is direct:
ROI (%) = (Annual savings − Annual system cost) / Annual system cost × 100
Payback period (months) = System total investment / Monthly savings
Annual savings are the sum of:
- Rework reduction: (rework labour hours saved × hourly rate) + (rework consumables saved)
- Scrap reduction: (scrap parts avoided × average scrap cost per part)
- NDT labour reduction: (inspection hours replaced by automated data × hourly rate)
- Warranty reduction: (claims avoided × average claim cost × attribution percentage)
Annual system cost includes:
- Hardware amortisation: system capital cost ÷ economic life (typically 3–5 years)
- Software licence or annual maintenance contract
- Integration and commissioning cost, amortised over economic life
- Training — usually a one-time cost, amortised in year 1
Conservative reduction benchmarks — apply these unless you have line-specific pilot data:
| Metric | Conservative estimate | Best-case |
|---|---|---|
| Rework rate reduction | 30% | 60% |
| Scrap rate reduction | 25% | 50% |
| NDT inspection rounds replaced | 20% | 40% |
| Warranty claim reduction (attributed to weld quality) | 15% | 35% |
Use the conservative column in the finance submission. The best-case column belongs in the engineering appendix as the upside scenario.
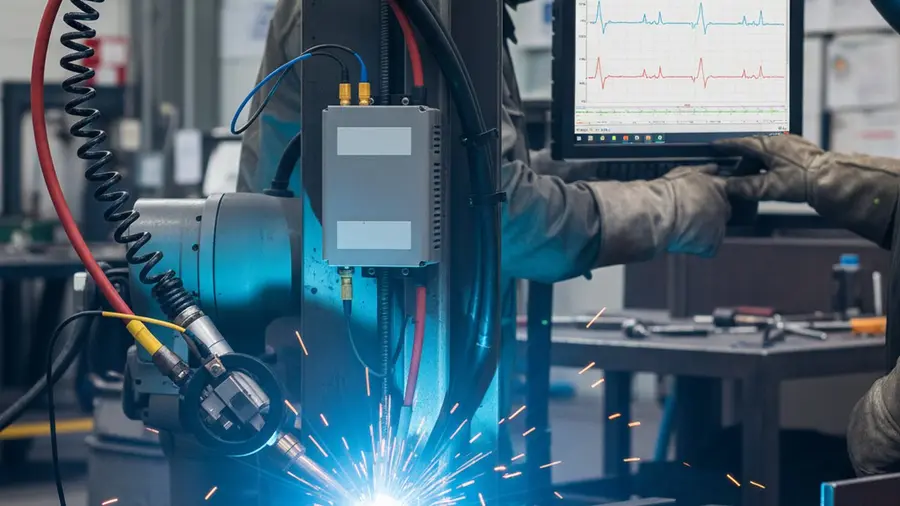
A welding inspection camera integrated into the weld cell captures thermal and visual process data at weld-cycle resolution. That data record replaces the manual visual inspection round — the 20–40% NDT labour saving is the most straightforward credit to document because it directly maps to fewer man-hours per shift.
Break-Even Analysis: What Payback Looks Like in Practice
Worked example: structural steel fabricator, 2-shift operation, 4 weld stations
| Parameter | Value |
|---|---|
| Annual welding production cost | €1,800,000 |
| COPQ baseline (7% of production — mid range) | €126,000 / year |
| Rework saving — 30% of rework portion (est. 50% of COPQ) | €18,900 / year |
| Scrap saving — 25% of scrap portion (est. 30% of COPQ) | €9,450 / year |
| NDT labour saving — 20% of €40,000 annual NDT budget | €8,000 / year |
| Warranty saving — 15% of €60,000 annual warranty attribution | €9,000 / year |
| Total annual savings | €45,350 |
| System investment (hardware + integration, 4 stations) | €48,000 |
| Annual maintenance and software licence | €5,000 |
| Year-1 total system cost (investment + maintenance) | €53,000 |
| Payback period | ~14 months |
This scenario deliberately uses conservative estimates and a mid-range COPQ. Plants with higher scrap rates, more expensive base materials (aluminium alloys, stainless, titanium), or tighter customer quality requirements will see shorter payback periods.
For high-value, low-volume applications — aerospace structural brackets, nuclear pressure vessel nozzles — a single prevented nonconformance can cost €20,000–€200,000 in re-inspection, concession management, and schedule impact. In those environments, one avoided NCR can recover the system investment within the first quarter of operation.
ISO 3834-2 requires monitoring and recording of welding parameters for comprehensive quality requirements. A monitoring system that logs thermal signature, voltage, current, and wire feed rate for every weld satisfies this requirement automatically, eliminating the manual parameter logging burden (typically 0.5–1.5 engineer-hours per shift) as an additional credit.
For orbital TIG pipe welding monitoring on high-purity applications, the combination of automated parameter logging and real-time anomaly detection has delivered payback below 12 months consistently across reference deployments — driven by the high cost of a single rejected weld on orbital joints.
Non-Financial Returns You Can Quantify
The financial ROI gets the project approved. Non-financial returns keep the system on budget at the year-two review.
1. ISO 3834 and ISO 9001 audit preparation
A real-time monitoring system generates weld-by-weld process records automatically. Each internal or external audit visit that previously required 2–4 engineer-days of manual data compilation becomes a structured data export. At an internal rate of €500–€800 per day, three audits per year represent €3,000–€9,600 in avoided preparation cost. The ISO 9001 cost-of-quality framework recognises this as a reduction in appraisal cost.
2. Customer qualification and Factory Acceptance Tests
OEM customers in automotive (EN 15085), energy (ASME Section IX), and rolling-stock sectors increasingly require documented weld process records as part of annual supplier audits and FAT. A monitoring system provides those records in searchable, exportable format. The cost of losing a supplier qualification due to incomplete records — re-qualification visit, expedited documentation, potential contract pause — typically exceeds the system hardware cost in a single event.
3. Field failure traceability
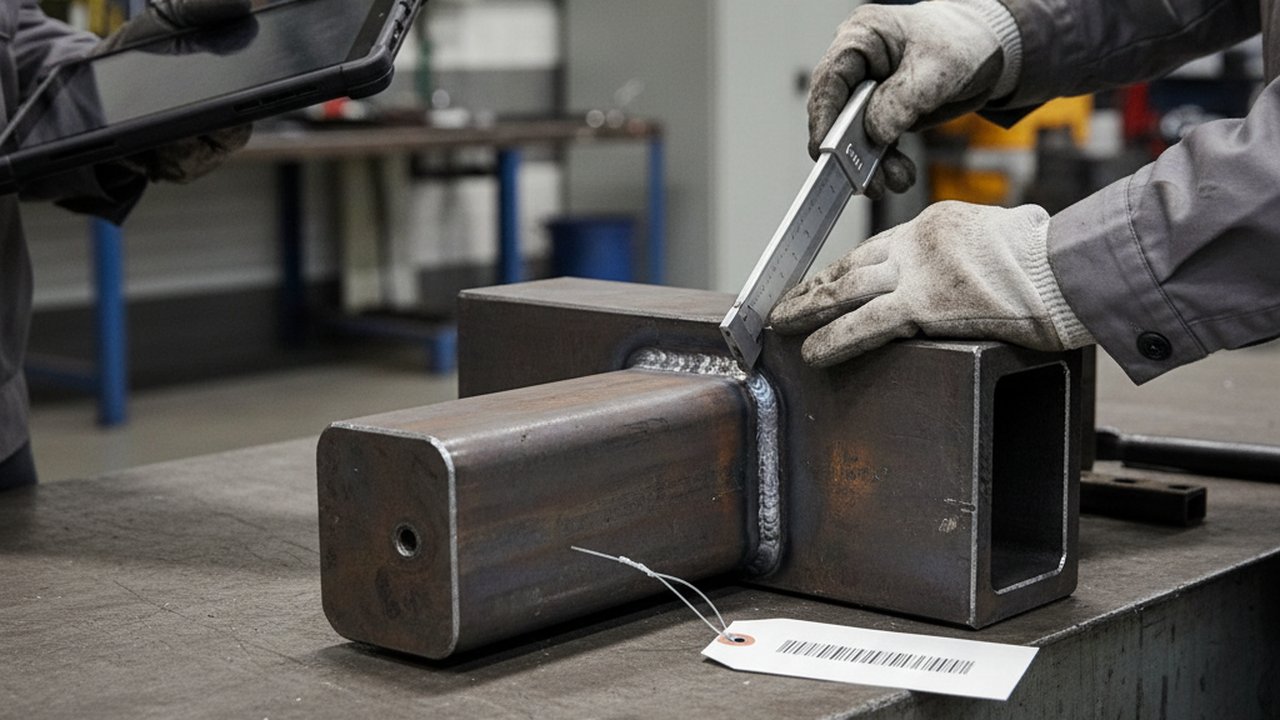
When a field failure is reported, retrieving the exact welding parameters for the affected part from a database reduces investigation time from weeks to hours. EN 1090-2 requires traceability records for structural steel weldments. A monitoring system is the lowest-friction mechanism to satisfy that requirement and demonstrate it to auditors.
4. Welder qualification evidence
For facilities operating under ISO 9606-1 welder qualification, monitoring data provides objective evidence of process adherence that complements certification status. The data supports qualification renewal decisions and identifies training needs before they become nonconformances — a cost avoidance that is difficult to quantify but immediately visible to the welding supervisor.
The IIW — International Institute of Welding publishes guidance on quality management requirements for welded fabrications that maps these non-financial requirements directly to monitoring system capabilities. The IIW guidance is useful primary source material in the certification-readiness section of the business case.
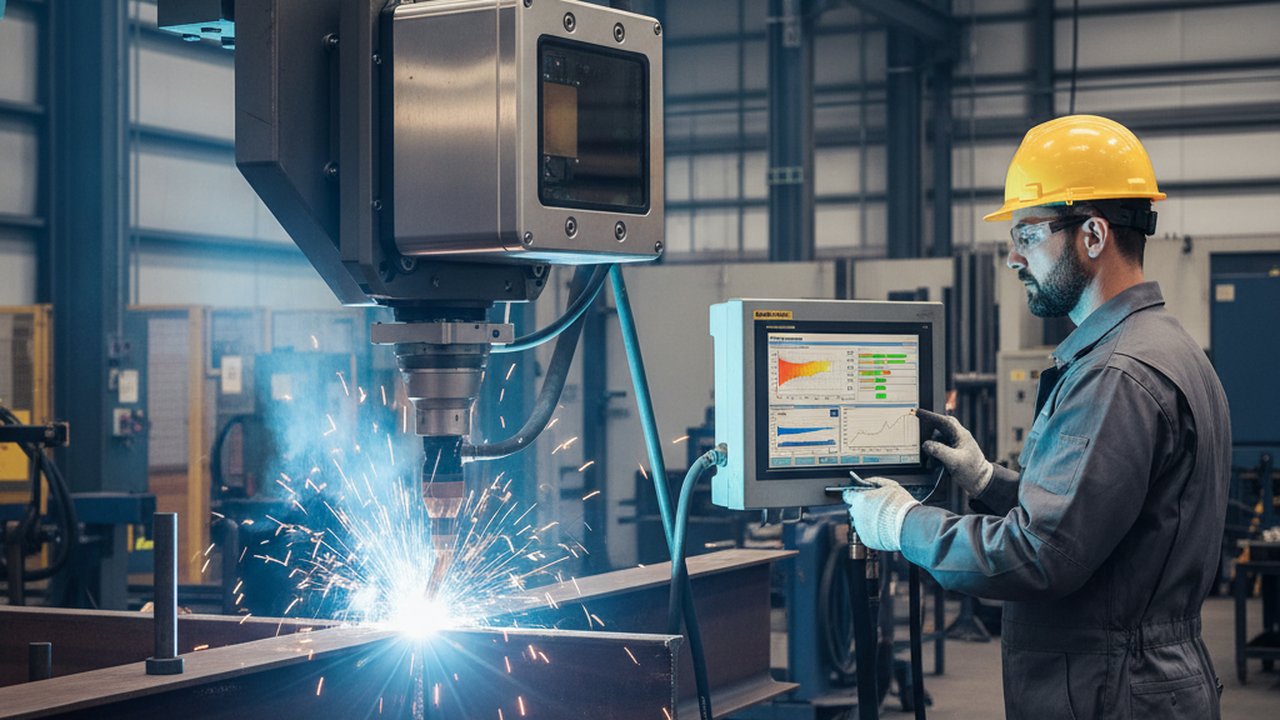
A welding process monitoring camera bridges the gap between parameter logging and defect detection — it records the pool-level visual evidence that distinguishes “parameters were within procedure limits” from “the fusion profile was conforming” at each weld.
Building the Business Case for Management
Structure the justification document in four sections that finance and operations both recognise:
Section 1 — Baseline cost of poor quality
Use 12-month COPQ actuals from ERP and maintenance logs. Present the total and break it into rework, scrap, NDT, and warranty. Avoid estimates where data exists — actual numbers from your own system carry more weight than industry benchmarks. If data is partial, note the gap and apply a conservative fill-in rather than excluding the category.
Section 2 — Projected savings
Apply the conservative reduction percentages and show the arithmetic explicitly. Finance will question opaque numbers; a visible calculation signals credibility. Reference the TWI and AWS cost-of-quality guidance as independent benchmarks for your reduction assumptions. If you have pilot data from a trial on one station, use that rate — it is always more persuasive than industry averages.
Section 3 — Investment as three-year TCO
Present hardware, integration, training, and annual maintenance as a total cost of ownership over three years. This absorbs the one-time integration cost and shows steady-state cost accurately — it prevents finance from dismissing the project as “too expensive” based on year-one optics while missing the declining annual cost in years 2–3.
Section 4 — Risk-adjusted payback
Run the model at 80% of projected savings (the “savings miss” scenario). If payback remains below 24 months, the investment is robust against execution risk. Finance teams respond positively to a pre-emptive downside scenario — it signals that the analysis is stress-tested, not optimistic. NIST guidance on manufacturing cost modelling supports this approach for capital equipment justifications.
Present the case at station level, not plant level. “Station 3 runs 180 welds per shift, generates 3.2 defects per 1,000 welds, and costs €42,000 per year in rework and scrap” is more compelling than a facility-wide average. Station-level specificity makes the argument concrete, anchors the savings claim to observable production data, and gives the project sponsor a clear deployment sequence to present to operations.
Engage production engineering early in the process — before the finance submission — to surface the NDT labour data that typically provides the strongest single credit in the savings model. That conversation also surfaces integration constraints that affect the investment estimate.
Tracking ROI After Deployment
Measuring post-deployment ROI closes the investment cycle, validates the business case, and builds the evidence base for the next capital request.
Establish a 90-day pre-deployment baseline for these metrics:
- Defect escape rate: defects confirmed at post-weld NDT or field per 1,000 welds
- Rework hours: labour hours booked to weld rework per 1,000 welds
- Scrap rate: rejected parts per 1,000 welds (by reason code)
- NDT inspection hours: VT rounds and re-test hours per week
- First-pass yield: percentage of welds accepted without rework at first NDT check
Measure the same metrics at 30, 60, and 90 days post-deployment. The 90-day window smooths production variation and gives a reliable comparison against the pre-deployment baseline.
Publish a 90-day post-deployment report using the same four-section structure as the business case. This document serves two audiences: the finance team (proof of return on capital) and the next procurement cycle (evidence that monitoring ROI is real and repeatable at this plant).
For parameter exceedance rate — the percentage of welds flagged by the monitoring system versus confirmed defects — track this as a calibration metric. A high false-positive rate signals that alarm thresholds need adjustment; a low detection rate with known escapes signals that the sensor configuration or monitoring scope needs review. Both are normal in the first 30–60 days and correctable without system changes.
In EV battery pack laser welding and other high-speed, high-volume lines, the defect escape rate metric is particularly sharp: cycle times are fast, volumes are high, and a single missed defect can propagate across an entire battery module assembly. The ROI case for monitoring in those applications is among the most straightforward in manufacturing — the cost of a single field recall dwarfs the system investment by two to three orders of magnitude.
Revisit the ROI model annually and update it with actuals. A system that delivers 45% rework reduction instead of the projected 30% makes the next capital request easier — and changes the conversation from “justify the cost” to “where else can we deploy this?”
FAQ
How do you calculate welding monitoring system ROI?
ROI (%) = (Annual savings from defect reduction − System annual cost) / System annual cost × 100. Savings include avoided rework, scrap, warranty claims, and post-weld NDT labour. A typical 2-shift line deployment sees payback in 6–18 months when conservative reduction estimates are applied.
What is the cost of a weld defect?
Direct rework costs range from €150–€800 per defect depending on weld type and repair complexity. Field failures carry additional warranty, liability, and re-inspection costs. Research from TWI estimates total defect cost at 5–12% of welding production cost before real-time monitoring is introduced.
What savings does a welding monitoring system deliver?
Primary savings: rework and scrap rate reductions of 30–60%, lower NDT inspection frequency as automated records replace manual visual rounds, and earlier defect detection that prevents downstream assembly failures. Secondary savings include automated ISO 3834 parameter documentation and reduced warranty exposure.
How long is the payback period for a welding monitoring system?
Payback periods of 6–18 months are typical for high-volume production lines with 2 or more shifts and 4 or more weld stations. Low-volume, high-value applications — aerospace, nuclear pressure equipment — often pay back in under 6 months because a single avoided nonconformance can cost more than the monitoring system itself.
What ROI metrics should I track after deploying a weld monitoring system?
Track: defect escape rate (defects reaching post-weld NDT or the field per 1,000 welds), rework hours per 1,000 welds, scrap rate (%), NDT labour hours per week, and first-pass yield. Compare a 90-day pre-deployment baseline to the 90-day post-deployment period to isolate system impact from production variation.
Does welding monitoring ROI include quality certification benefits?
Yes. ISO 3834-2 requires monitoring and recording of welding parameters. A real-time monitoring system generates those records automatically, reducing manual documentation effort and accelerating internal audits and customer qualification visits. A conservative estimate is 1–3 engineer-hours saved per audit cycle — real and recurring, even if harder to capture in the primary ROI model.
What is the difference between welding monitoring ROI for manual vs robotic welding?
Robotic welding lines benefit from fast feedback — the system flags parameter drift and can halt the cell before the next weld cycle, containing scrap at the part level. Manual welding lines benefit more from traceability and objective operator data: monitoring distinguishes welder skill variation from procedure non-compliance, enabling targeted corrective action rather than blanket re-inspection or rework.
How do I build a business case for a welding monitoring system?
Four sections: (1) baseline cost of quality — 12-month actuals for rework, scrap, NDT, and warranty from ERP and maintenance logs; (2) projected savings — conservative reduction percentages with visible arithmetic and industry benchmark references; (3) investment as 3-year TCO — hardware, integration, training, and annual maintenance; (4) risk-adjusted payback — model at 80% of projected savings to demonstrate robustness under execution risk.
Calculate Your Welding Monitoring System ROI
Bring your rework and scrap rates. Our engineering team will build a line-specific ROI model and payback calculation for your configuration.
Book a Free ROI ConsultationFrequently Asked Questions
How do you calculate welding monitoring system ROI?
ROI (%) = (Annual savings from defect reduction − System annual cost) / System annual cost × 100. Savings include avoided rework, scrap, warranty claims, and post-weld NDT labour. A typical 2-shift line sees payback in 6–18 months when conservative reduction estimates are applied.
What is the cost of a weld defect?
Direct rework ranges from €150–€800 per defect depending on weld type and repair complexity. Field failures add warranty, liability, and re-inspection costs. TWI estimates total defect cost at 5–12% of welding production cost in facilities without real-time monitoring.
What savings does a welding monitoring system deliver?
Primary savings: rework and scrap rate reductions of 30–60%, lower NDT inspection frequency as automated data replaces manual visual rounds, and earlier defect detection that prevents downstream assembly failures. Secondary savings include ISO 3834 documentation automation and reduced warranty exposure.
How long is the payback period for a welding monitoring system?
Payback periods of 6–18 months are typical for high-volume production lines (≥2 shifts, ≥4 weld stations). Low-volume, high-value applications such as aerospace or nuclear pressure vessels often pay back in under 6 months because a single nonconformance can cost more than the system itself.
What ROI metrics should I track after deploying a weld monitoring system?
Track defect escape rate (defects reaching post-weld NDT or the field), rework hours per 1,000 welds, scrap rate (%), NDT labour hours per week, and first-pass yield. Compare a 90-day pre-deployment baseline to the 90-day post-deployment window to isolate system impact from process variation.
Does welding monitoring ROI include quality certification benefits?
Yes. ISO 3834-2 requires monitoring and recording of welding parameters. A real-time monitoring system generates weld data records automatically, reducing manual documentation effort and accelerating internal audits and customer qualification visits. Estimate 1–3 engineer-hours saved per audit as a conservative credit.
What is the difference between welding monitoring ROI for manual vs robotic welding?
Robotic lines benefit from fast feedback — the system flags parameter drift and can halt the cell before the next weld, containing scrap. Manual lines benefit more from traceability and operator guidance: monitoring data distinguishes welder skill variation from procedure non-compliance, enabling targeted corrective action rather than blanket rework.
How do I build a business case for a welding monitoring system?
Four sections: (1) baseline cost of quality — actual rework, scrap, and NDT cost per year from ERP and maintenance logs; (2) projected savings — conservative reduction percentages supported by industry reference data; (3) investment cost — hardware, integration, training as a 3-year TCO; (4) risk-adjusted payback — show the downside scenario where savings are 20% lower than projected.