A photovoltaic plant can be inspected in four main ways: an infrared flight over the whole field, infrared thermography from the ground, electroluminescence imaging of the cells, and I-V curve tracing on strings or modules. They are not competing options. Each answers a different question, at a different scale and cost per module, and a sound inspection usually combines two or three in a set order.
This article explains what each method shows, what it misses, and how to sequence them for acceptance, routine operation and maintenance, damage assessment or due diligence. How to make the resulting report hold up as evidence is covered in drone thermography as defensible PV inspection evidence.
Key takeaways
- Aerial infrared answers “where” across the whole plant. The other methods answer “why” and “how much” on the modules the flight flagged.
- Ground thermography gives more detail per module and covers balance-of-system components at close range.
- Electroluminescence shows cell cracks and inactive areas, including damage with no thermal signature yet. It is a targeted test.
- I-V curves quantify the electrical effect of a fault and show degradation without a clear thermal pattern.
- The usual order is aerial first, then targeted ground methods. The inspection purpose decides how far down that list to go.
Aerial infrared: the whole plant, quickly
A drone with a radiometric infrared camera flies the plant and records every module, typically together with visible images. The result is a georeferenced mosaic where each anomaly is mapped to its module and string. Typical findings include hot-spot cells, hot substrings from bypass-diode failures, strings running uniformly warm when open-circuited, and patterns at array edges that point to potential-induced degradation.
What it needs: stable weather and enough irradiance for temperature differences to be meaningful, attention to emissivity and reflections on the glass, and a ground sampling distance chosen for the anomaly size the report must resolve.
What it misses: the cause of an anomaly is not always visible from the air. Soiling, shading and a cell defect can look alike, and some damage, such as micro-cracks, may not show a thermal difference yet.
Ground thermography: detail where the flight raised a question
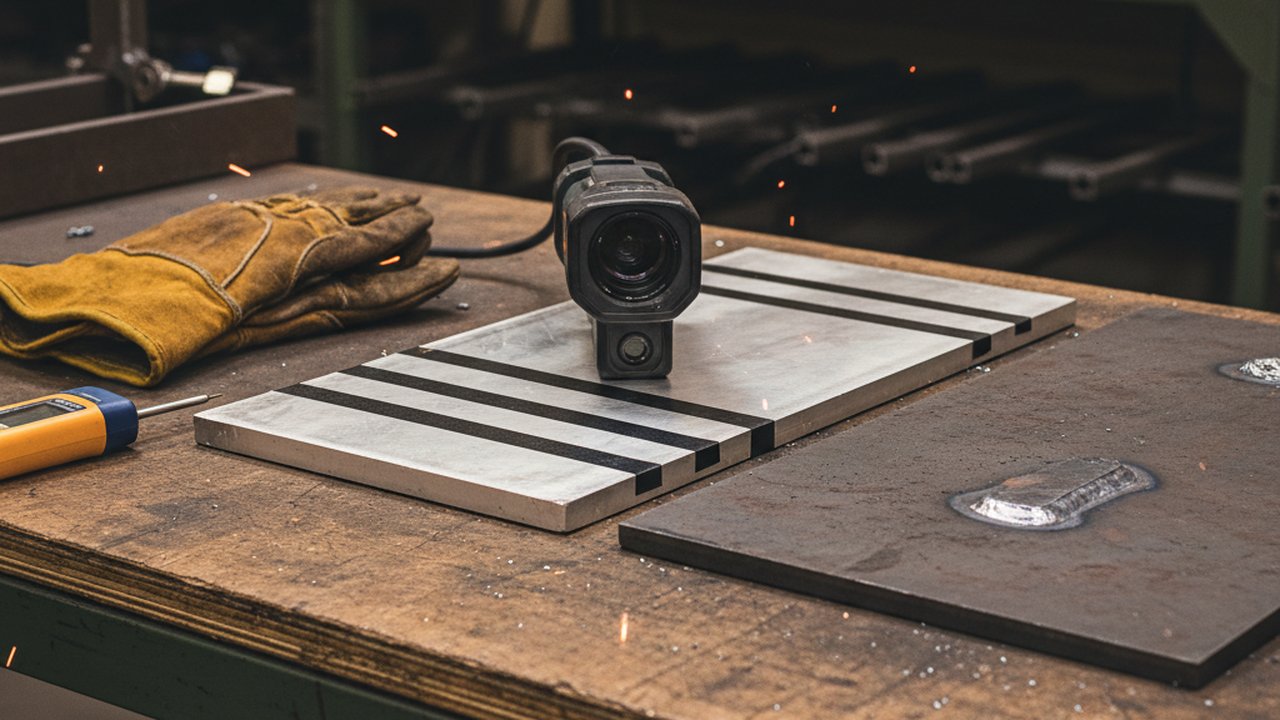
A thermographer on the ground looks at individual modules at close range, and at the balance-of-system components that a drone view resolves poorly: combiner boxes, connectors, inverters and switchgear. It is slower per module than a flight, so it is used on the anomalies the flight found and on the electrical equipment, not across the whole field.
What it adds: a closer, more detailed thermal image of a specific module or component, and a second viewing angle that helps separate a real defect from a reflection or soiling.
Electroluminescence: the cell structure itself
Electroluminescence drives current through the module and images the light the cells emit. Cracks, broken fingers and inactive cell areas show up as dark regions. It reveals damage that has not yet produced heat, which matters after hail, transport or installation damage.
What it needs: low ambient light, usually night-time or a shaded enclosure, and a power supply to drive the modules. That makes it slow and targeted: a sample of modules, or the ones an aerial or ground survey flagged.
I-V curve tracing: the electrical effect
An I-V curve tracer measures how a string or module converts light to current and voltage. Comparing the measured curve with the expected one shows whether output is reduced, and the shape of the curve points to the kind of loss: series resistance, shunting, mismatch or bypass-diode activity.
What it adds: a quantified electrical effect. Thermography says where a module looks abnormal; the I-V curve says how much that anomaly costs in output.
Choosing and sequencing the methods
| Purpose | Start with | Add where needed |
|---|---|---|
| Acceptance before handover | Aerial infrared on the full plant | Ground thermography and I-V on flagged strings |
| Routine operation and maintenance | Aerial infrared, compared year on year | Ground thermography on recurring anomalies |
| Damage after hail or storm | Aerial infrared | Electroluminescence on a sample of affected modules, I-V on affected strings |
| Due diligence before acquisition | Aerial infrared on the full plant | I-V and electroluminescence on a sample to quantify defects |
Decide the order before the site visit. A flight that finds anomalies with no plan for ground validation leaves a list of suspicions, not a report the owner or the insurer can act on.
Where Therness fits
The Therness PV thermography service covers aerial infrared surveys with radiometric cameras, georeferenced IR and visible mosaics, and a report with a defect map and severity per module and string. Doubtful cases are checked on the ground with close-range thermography and, where needed, I-V measurements on sampled modules. Electroluminescence is not part of the service scope. Ground thermography of inverters, switchgear and other plant equipment is covered by the industrial thermography service.
Plan the inspection order before the flight
Therness can help set the scope of an aerial infrared survey and the ground validation that follows, for acceptance, maintenance or damage assessment.
Discuss your PV plantFrequently Asked Questions
Which inspection method should a PV plant start with?
Usually an aerial infrared survey, because it covers every module in a short time and shows where the anomalies are. It answers "where", not always "why". The other methods are then used on the modules and strings the flight flagged, rather than across the whole plant.
When is ground thermography needed after a drone flight?
When an aerial finding is doubtful or needs a closer look: a hot spot that could be soiling or a cell defect, a string anomaly that needs confirmation at the combiner box, or balance-of-system components the drone view does not resolve. Close-range thermography gives more detail per module and reaches assets the flight does not see well.
What does electroluminescence show that infrared does not?
Electroluminescence images the cell structure itself: cracks, broken fingers and inactive cell areas, including damage that does not yet produce a thermal signature. It needs the module to be driven with current in low ambient light, so it is a targeted test, not a plant-wide screening.
What do I-V curve measurements add?
An electrical measure of how a string or module actually performs: whether its output and curve shape match what is expected. It quantifies the effect of a fault that thermography located, and it can show degradation that has no clear thermal pattern.
Do all four methods need to be used on every inspection?
No. The order is usually aerial infrared first, then ground thermography, I-V measurements or electroluminescence only where the flight raised a question the report has to answer. Which methods are needed depends on the purpose: acceptance, routine operation and maintenance, damage assessment or due diligence.