R&D, in development. What follows is research from an internal Therness campaign, not a function of HeatCore or WeldTrace, and not a performance we guarantee. Whether it becomes part of a product is still being evaluated.
A welding arc talks the whole time it is on. Its electrical signal and the wire feeding into it carry a record of what the process is really doing — a record that is lost the moment the bead cools, and that no visual inspection recovers. We asked a narrow question about that record: how little computation does it take to notice that a bead does not belong to the program that was supposed to be running?
The question we put to the data
A welding cell runs a program: a set of settings the operator loads before the arc starts. Two things go wrong more often than they should, and both are cheap to describe and expensive to find late:
- the wrong program runs. The right settings are on the drawing, the wrong ones are in the machine, and the first evidence is a part that fails inspection or a customer that finds it later;
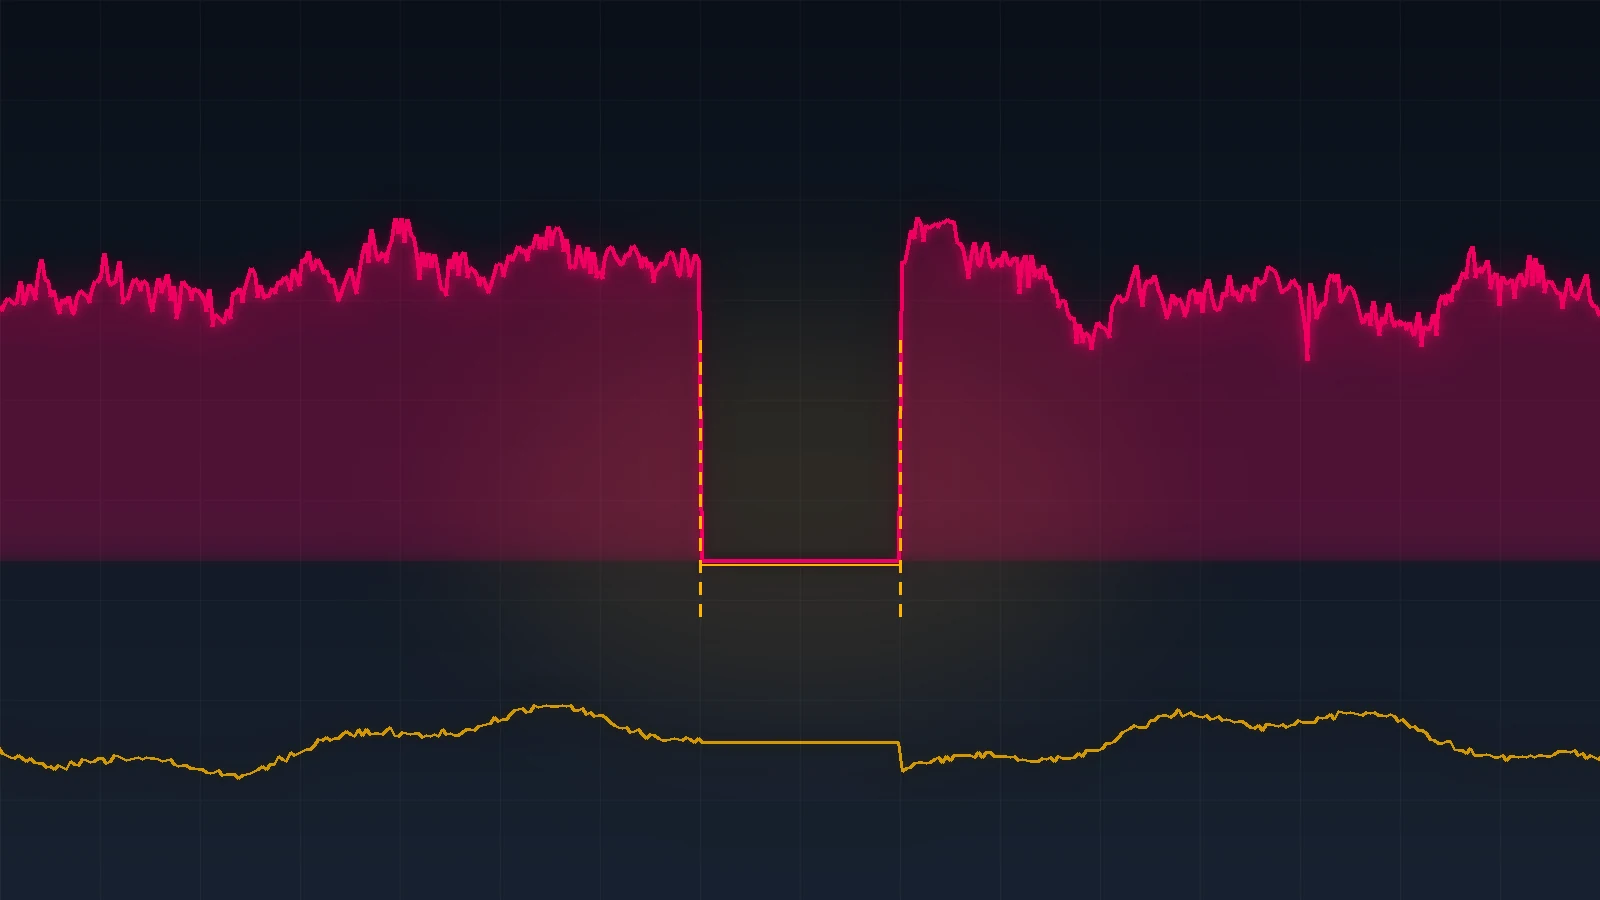
- the arc stops and comes back. A fraction of a second without arc leaves a bead that looks continuous and is not.
On a run of 189 clean beads from one internal campaign — a development cell, October 2026 — we tested a small detector that watches nothing but the electrical signals of the arc and the wire feed. No camera, no model, no GPU. The goal was not to classify defects. It was to answer one question per bead: does this bead look like the program it was welded with?
What the signal gave us
| What we measured | Result | What kind of evidence it is |
|---|---|---|
| Beads in the campaign | 191 welded, 189 clean beads used as reference | measured, internal campaign of 19 October 2026 |
| Wrong welding program, recognised | 100% (36 of 36, and 153 of 153) | a fact of the test plan |
| Arc interruption of 50 ms, caught | 87.8% of the beads (82–92% confidence range) | interruptions simulated on real beads |
| Clean beads flagged (false alarms) | 3 of 189 = 1.6% | reference judged by an independent visual and thermal check: a lower bound |
| Cost of the computation | 0.029 s of CPU per bead on a single core — 0.29% of the recorded welding time | measured, no GPU |
Two of those numbers deserve to be read with the other one.
The bar we set before running the test was 90% for the 50 ms interruption. The detector did not reach it: it stopped at 87.8%, and the beads it missed are the ones where the interruption sits at the edge of the analysed bead rather than in the middle of it. At 300 ms the same detector catches 98.4%, and at 100 ms 93.1% — so the short interruption is the honest boundary of what this first version can do.
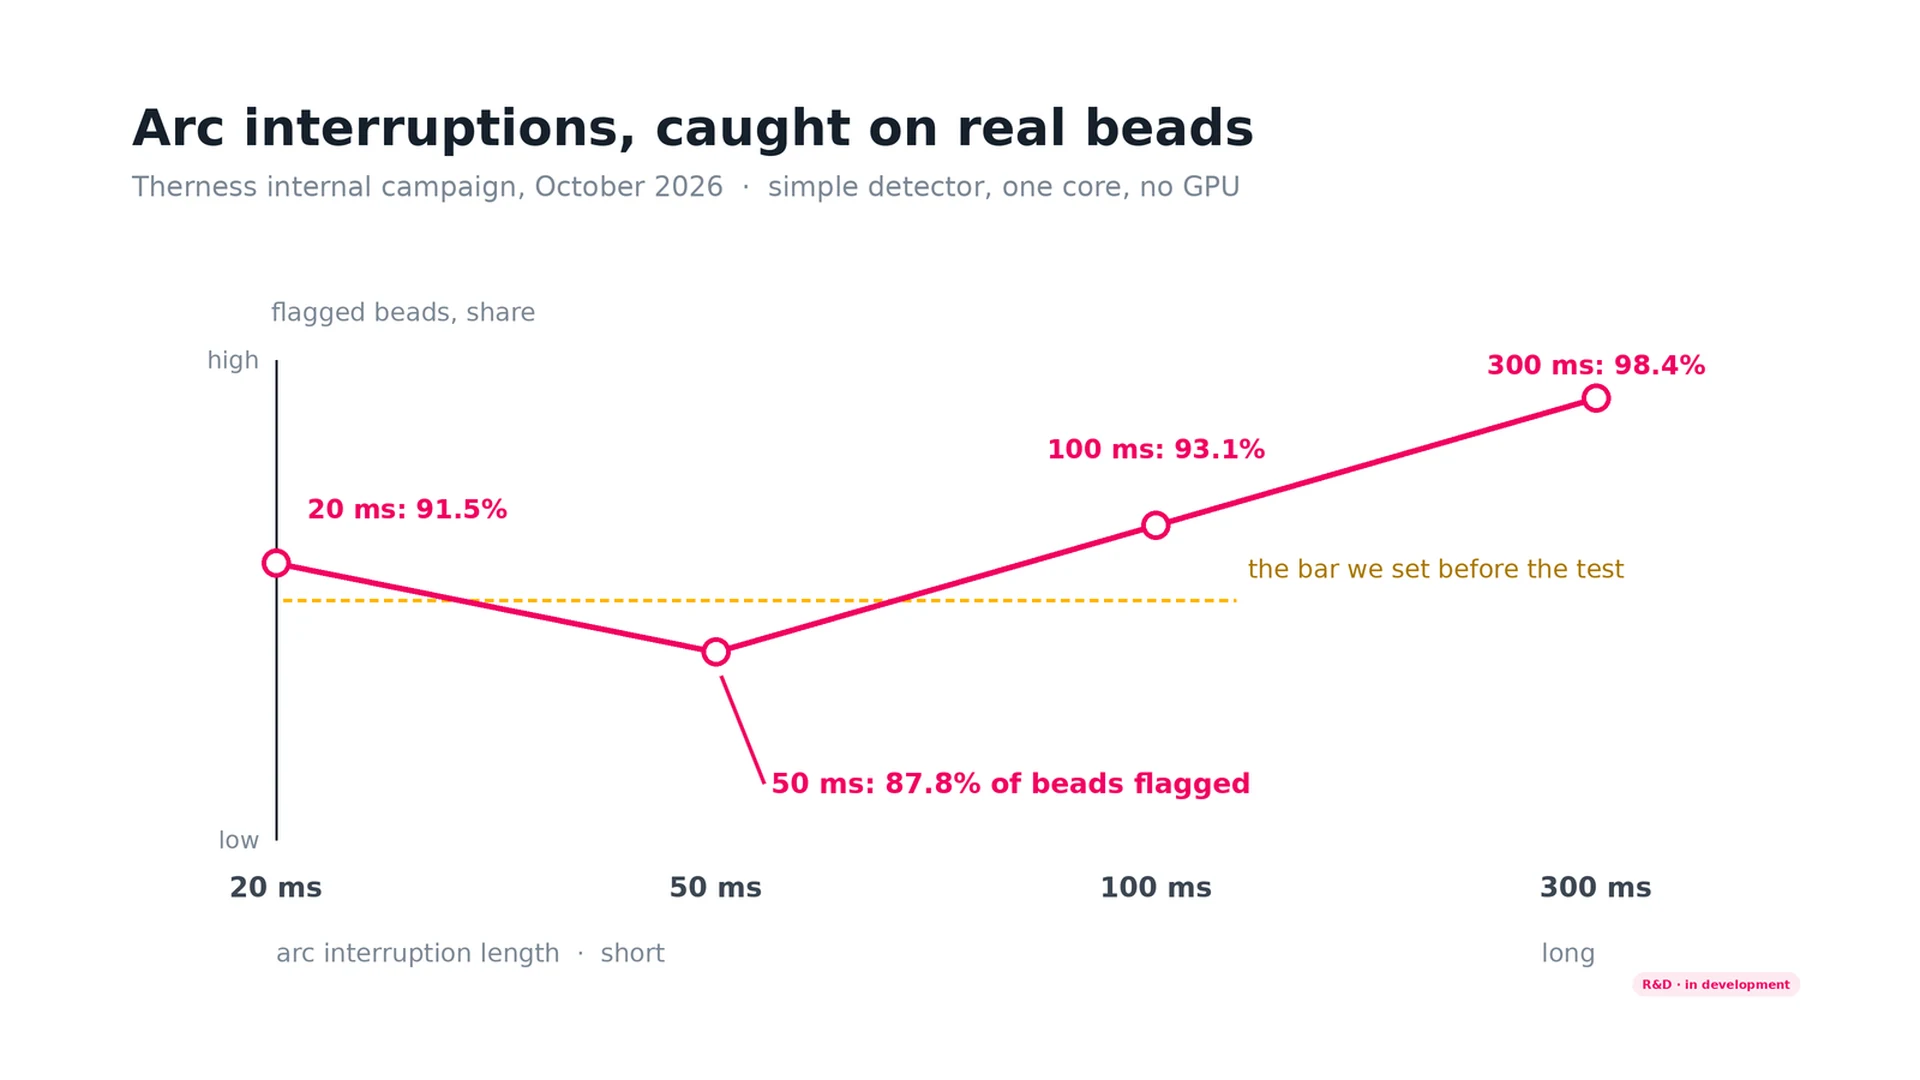
How much of the bead the detector caught as the interruption got longer. The vertical scale is qualitative on purpose; the values are the ones in the table above. The 50 ms case is the one that misses the bar we had set in advance. Data: Therness R&D, S14 campaign, October 2026 (Research Engineer).
The whole campaign in one picture
A single number hides what a run looks like. The next figure is the campaign bead by bead, in the order they were welded: 189 clean beads, and the three the detector flagged anyway. That is the 1.6%: three flags an operator would have had to look at, on a run with nothing wrong with it.
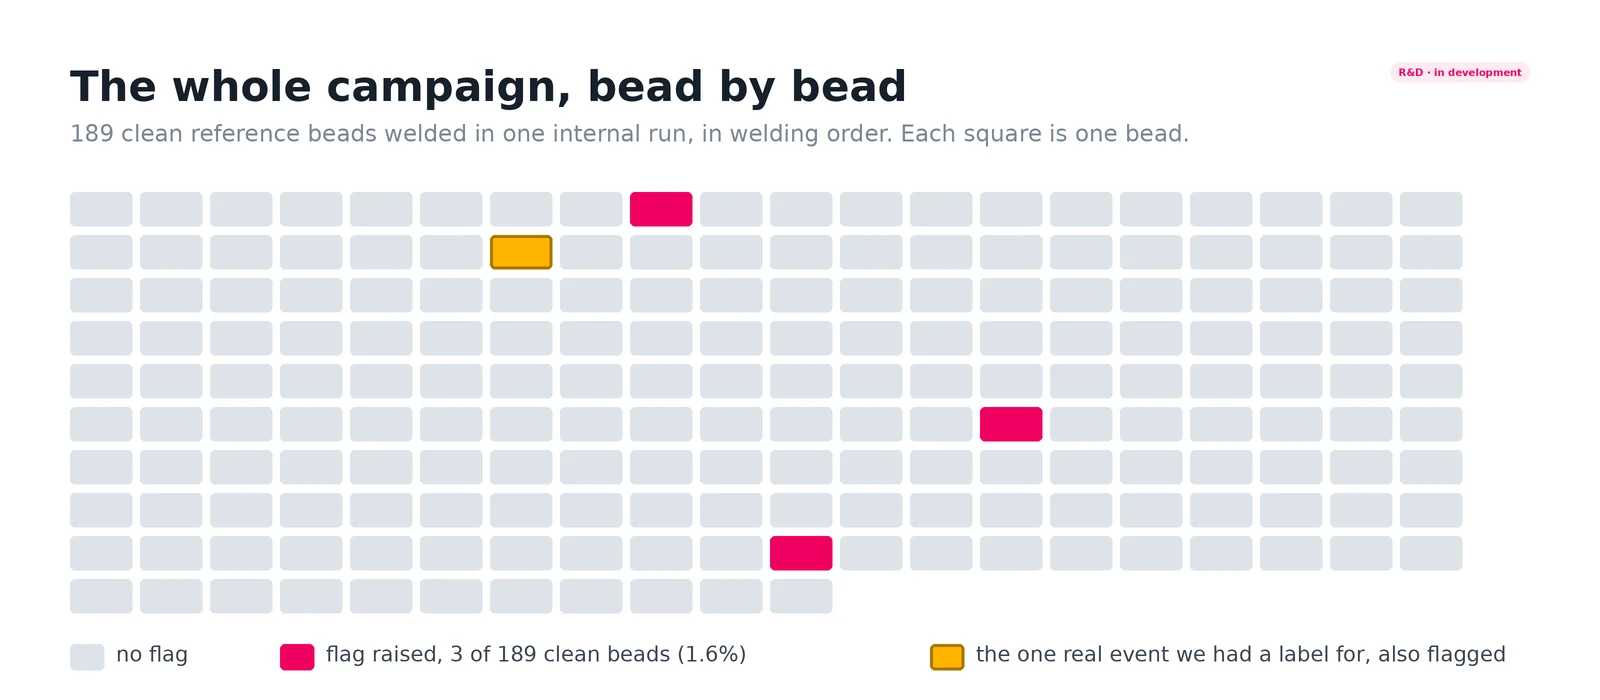
Each square is one bead in welding order. Three flags on clean beads (1.6%) and the one real event of the campaign, which was flagged too. Beads are not labelled: the picture shows the shape of the run, not the log. Data: Therness R&D, S14 campaign, October 2026 (Research Engineer).
How it decides, in words
For every welding program the software learns what a good bead looks like, from the beads welded with that same program. A new bead is compared with that reference. When a few quantities taken from the electrical signal and from the wire feed move out of the normal range in a robust way, and stay out for several consecutive checks, the bead is flagged.
The spectrum of the signal is used as a fingerprint of the program, and as a diagnostic view for our engineers, not as an alarm: in this campaign it added no detection of its own.
Nothing heavy sits behind it. Statistical thresholds, arithmetic on a single core, no GPU and no trained deep network — which is why the cost stays at 0.029 s of CPU per bead.
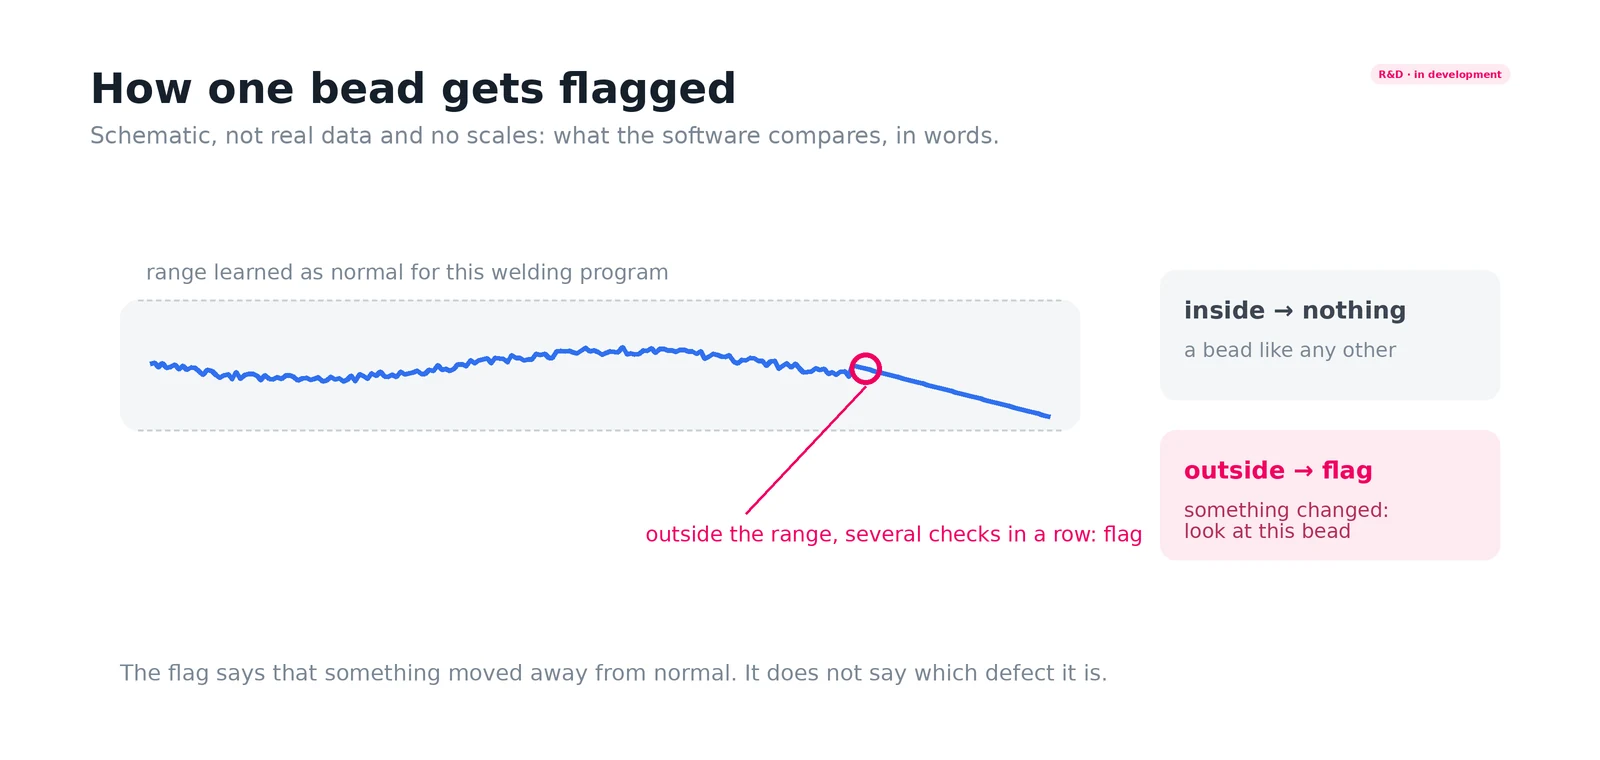
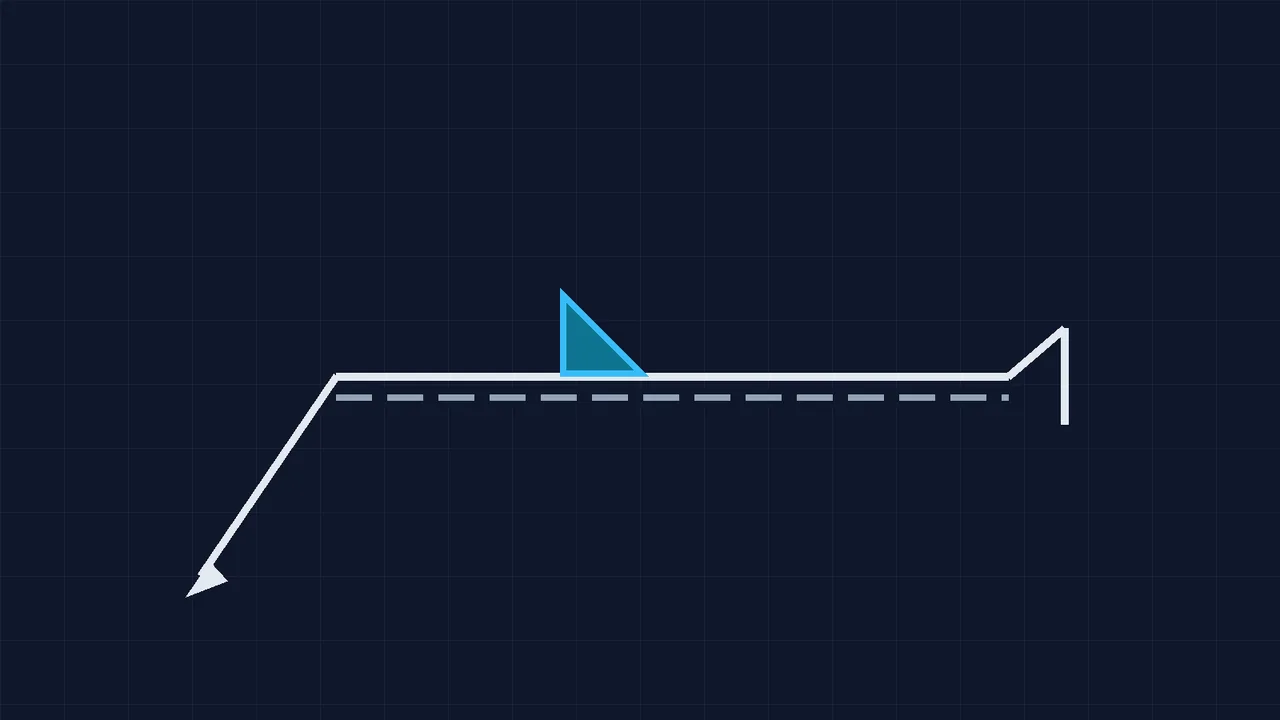
Schematic, not real data and no scales. A bead that stays inside the range learned for its program raises nothing; a bead that leaves it for several consecutive checks raises a flag. The flag says that something changed, not which defect it is.
The limits, next to the numbers
These limits matter more than the percentages:
- One campaign. Same day, same wire, same gas, same plate, a development cell. No customer part, no production line, no second material.
- The interruptions were simulated. They were injected into real beads to have a known answer. The campaign contained exactly one real event with an independent label — a failed ignition of 2.7 s — and the detector flagged it.
- “Wrong program” means a big change. A different program, not a small drift inside the same one. A parameter that slowly wanders will not look like this.
- One channel was missing. The voltage channel was out of service during the campaign, so no classical arc analysis was possible on this data.
- No adversarial review was recorded. The study card was lost in a restore, so the result never went through our internal adversarial review. That is exactly why this is published as “R&D, in development” and not as a product function, a detection rate, or a guarantee.
- It is not a defect classifier. It flags a bead, not a porosity or a lack of fusion. Someone still has to look.
What it could mean for the parts you build
- A verdict per bead, while the part is still hot. A flag in the seconds after the bead closes is cheap to act on; the same information after machining is scrap.
- A safety net for the program, not only for the arc. The most expensive mistakes in a welding cell are often the boring ones: the wrong file, the wrong revision, the wrong settings loaded.
- A cheap companion to thermal monitoring. It runs beside the camera on the same edge computer, on signals the cell already produces, without a GPU.
If your process already records current and wire feed, the question this campaign asked is one you can ask of your own data: does each bead look like the program it was welded with?
Recording the arc on every weld?
WeldTrace captures the electrical signals of the arc on every weld, with the traceability to go back to any bead. Tell us what you weld and we will show you what the record looks like on your process.
See WeldTraceR&D, in development. Source: Therness internal campaign, October 2026. Figures drawn from the campaign results with qualitative axes; the diagnostic figures of the study are not published. Confidentiality review by the Head of R&D.