Weld porosity detection remains one of the most persistent challenges in industrial welding quality. Porosity — gas voids trapped inside a solidified weld — is invisible to the human eye during welding, survives visual inspection, and only shows up on radiographic or ultrasonic testing after the part is complete. By then, the cost of rework or scrap is already locked in.
Real-time thermal imaging changes this equation. By monitoring the thermal signature of the weld pool as it solidifies, modern systems like HeatCore can identify the process conditions that cause porosity while the arc is still running — not three shifts later on the NDT bench.
This post breaks down what causes weld porosity, how detection methods compare, and why inline thermal monitoring is becoming the preferred approach in high-throughput manufacturing.
What Is Weld Porosity and Why Does It Matter?
Porosity in welding refers to gas pockets or voids that form within the weld metal when gas is trapped during solidification. These voids weaken the cross-sectional area of the joint, act as stress concentration points, and — in pressure-containing or fatigue-loaded applications — can trigger catastrophic failure.
The American Welding Society classifies porosity by distribution and size:
- Distributed porosity — scattered gas voids spread throughout the weld bead
- Cluster porosity — grouped voids concentrated in a localised zone (often start/stop points)
- Piping porosity (wormholes) — elongated gas channels running parallel to the weld axis, often the most structurally damaging
Under ISO 5817:2014, porosity limits vary by quality level (B, C, D), with Level B (the strictest) permitting no surface pores and tightly limiting subsurface projected area. Automotive, aerospace, and pressure vessel applications routinely require Level B throughout.
Porosity discovered during post-weld NDT triggers NCR workflows, potential weld repair or scrapping of the assembly, and in regulated sectors, mandatory corrective action reports. The cost per incident in automotive body-in-white production can exceed €3,000 when rework labour and line stoppage are included.
Root Causes: What Creates Porosity?
Effective weld porosity detection starts with understanding the root causes. The most common are:
Shielding Gas Issues
Inadequate or contaminated shielding gas is the leading cause of porosity in MIG/MAG and TIG welding. Flow rate too low, a leak in the gas line, draught across the weld zone, or a blocked nozzle all allow atmospheric nitrogen and oxygen to enter the weld pool. The result is visible immediately in the thermal footprint: irregular cooling, unstable pool geometry, and characteristic surface blistering.
Contaminated Base Material or Filler
Oil, moisture, mill scale, paint, galvanising, and zinc coatings all introduce gas-generating compounds when heated. Even fingerprint oils deposited during part handling can generate localised porosity at the exact contact point.
Welding Parameter Drift
Travel speed too high, arc voltage too low, or wire feed instability all affect how gas can escape from the weld pool before solidification. Fast solidification — common with high travel speed — traps gas that would otherwise have time to float out.
Electrode or Wire Moisture
Absorbed moisture in flux-cored wire, basic electrodes, or submerged arc flux is a classic source of hydrogen-induced porosity, particularly in high-strength steels. Hydrogen porosity is especially dangerous because hydrogen migrates to stress zones and can cause delayed cracking.
In robotic welding cells running at high duty cycles, parameter drift and gas flow degradation are the dominant causes of sporadic porosity. These are impossible to detect with post-weld inspection alone — they must be caught process-side, in real time.
Traditional Weld Porosity Detection Methods
Current practice in most manufacturing facilities relies on post-weld NDT to detect porosity. The main methods:
Radiographic Testing (RT)
RT (X-ray or gamma-ray) is the most widely used method for volumetric porosity detection. It reveals gas pockets as darker regions on the radiograph because the voids have lower density than surrounding metal. RT is excellent for subsurface porosity but requires radiation safety protocols, is slow (typically 15-30 minutes per joint setup), and cannot be used inline.
Ultrasonic Testing (UT) / PAUT
Phased array UT can detect porosity by measuring sound attenuation and echo patterns. Modern PAUT systems are faster than RT and don’t require radiation, but they are sensitive to geometry and require a skilled operator. Contact UT cannot be performed until the weld is cool.
Visual Testing (VT)
VT can detect only surface-breaking porosity — visible pores on the bead surface. The large majority of porosity defects are subsurface and invisible to VT. VT provides zero insight into process conditions.
Dye Penetrant / Magnetic Particle
LP and MT detect surface-breaking discontinuities. Neither detects subsurface porosity.
All these methods share a critical limitation: they inspect after welding is complete. They tell you what went wrong but cannot prevent it. In a production environment running 500 welds per shift, catching a process deviation at weld #12 vs weld #487 is a large cost difference.
Thermal Imaging for Weld Porosity Detection: How It Works
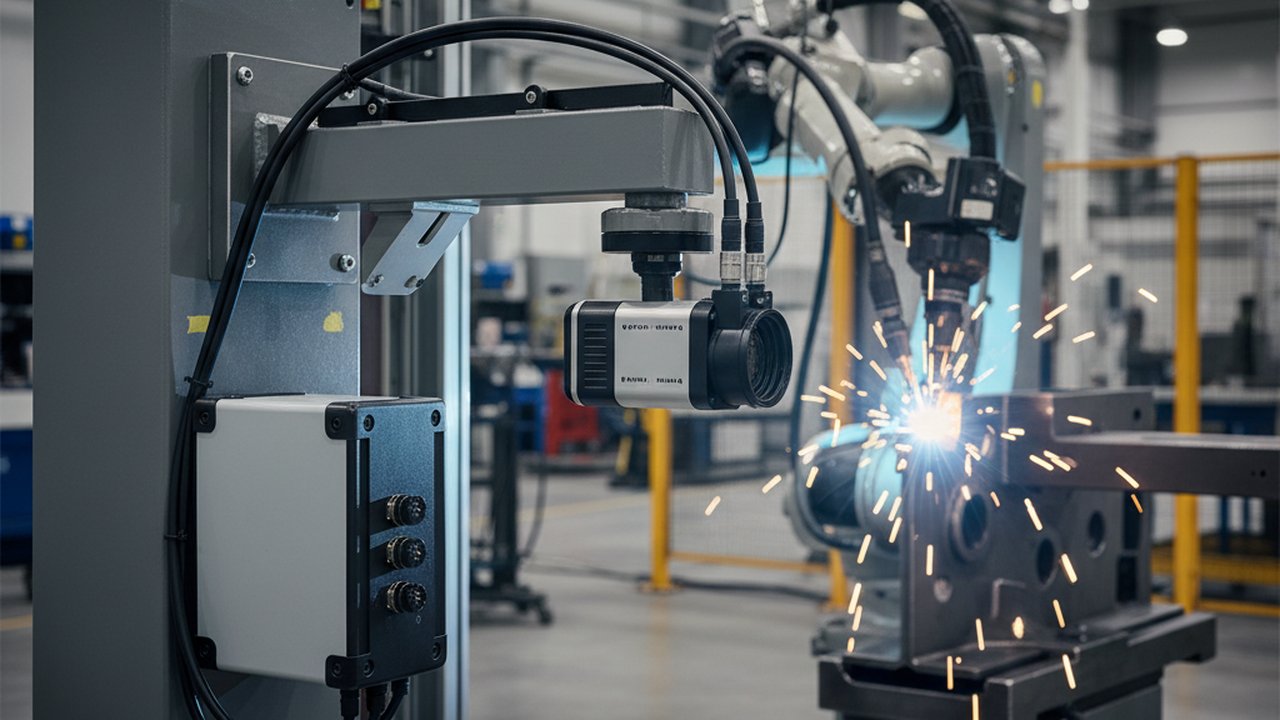
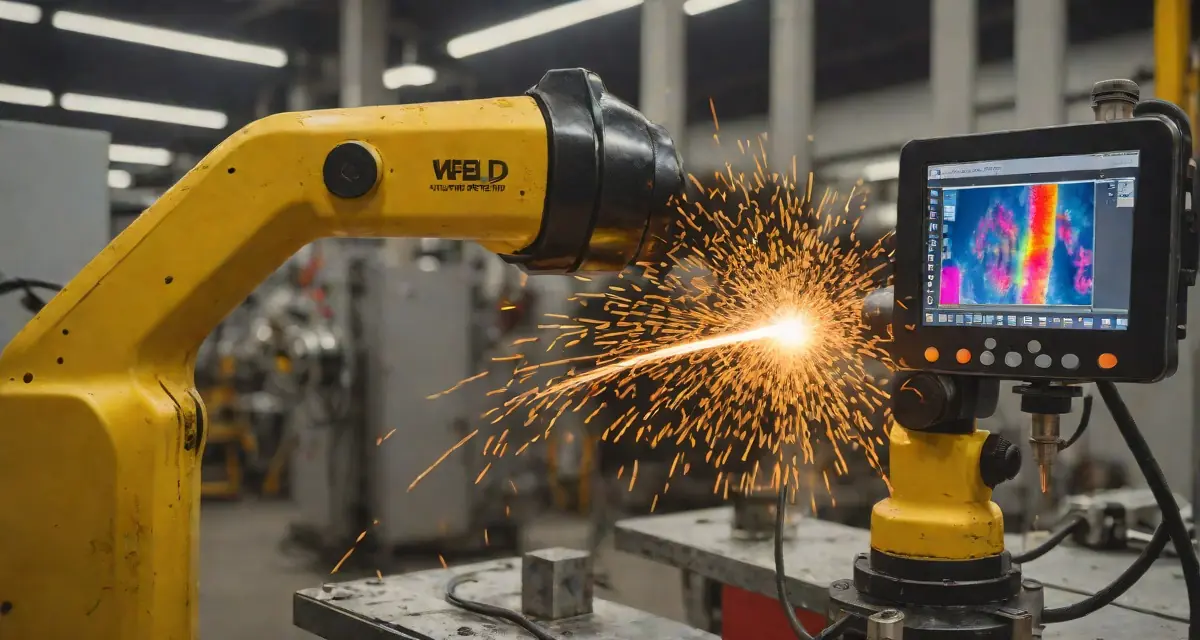
A thermal camera mounted on the welding torch or robot arm monitors the weld pool and heat-affected zone in real time. The physics are straightforward: trapped gas voids affect the local thermal mass, resulting in slightly different cooling rates compared to fully dense weld metal. But the more powerful detection mechanism is process-condition monitoring — catching the conditions that cause porosity before the void has even formed.
What HeatCore Monitors
HeatCore’s inline thermal monitoring captures several process signals simultaneously:
1. Weld pool geometry — Size, symmetry, and aspect ratio of the molten pool. Shielding gas failure produces immediate, characteristic changes in pool shape and surface texture visible in IR even before porosity forms.
2. Thermal gradient stability — Porosity-prone runs show irregular isothermal contours in the cooling zone behind the pool. HeatCore flags statistical outliers against the baseline for each joint type.
3. Arc stability index — Derived from the thermal time series, this correlates with voltage/current fluctuations that indicate shielding issues or wire irregularities.
4. Cooling rate (T8/5) — The cooling time between 800°C and 500°C is a direct indicator of microstructure and hydrogen trapping risk in high-strength steels. See our post on heat input and cooling rate monitoring for the metallurgical background.
Detection vs Prevention
The key advantage of inline thermal monitoring over NDT is the distinction between detection (finding defects after they exist) and prevention (catching process deviation before defects form). HeatCore operates primarily in the prevention mode: it alerts the operator or pauses the robot when process conditions deviate from the acceptable envelope, so the next weld — not the next batch — is corrected. Watch the AI weld monitoring system in action.
This is analogous to SPC (Statistical Process Control) applied at the weld pool level. For the theory behind SPC in welding contexts, see our post on SPC for welding with Xbar-R and Cpk.

Inline Thermal vs Post-Weld NDT: A Direct Comparison
| Factor | Post-Weld NDT (RT/UT) | Inline Thermal (HeatCore) |
|---|---|---|
| Detection timing | After completion | During welding |
| Subsurface porosity | Yes (RT/UT) | Indirect (process condition) |
| Coverage | 100% possible but slow | 100% automated |
| Stops defect production | No | Yes (alert/pause) |
| Documentation | Manual report | Automatic, per-bead |
| ISO 3834 traceability | Separate records | Built-in, timestamped |
| Cost per inspection | High (skilled operator) | Low (automated) |
| Integration with MES | Manual transfer | API / OPC-UA |
When to Use Each Approach
Inline thermal monitoring does not replace all NDT. In regulated sectors (pressure equipment, aerospace, structural), post-weld RT or UT remains a code requirement regardless of how good your process control is. The value of HeatCore in those environments is risk reduction and efficiency — fewer defects reaching NDT means fewer non-conformances, faster throughput, and smaller NDT backlogs.
In non-regulated high-volume production (automotive body-in-white, general structural fabrication), inline monitoring can substitute for 100% post-weld NDT, reducing inspection cost while maintaining — or improving — overall quality levels.
For a complete view of how different inspection methods compare across cost and defect type, see our post welding inspection methods compared: VT, RT, UT, PAUT, and inline monitoring.
Integrating Weld Porosity Detection into Your QMS
Weld porosity data only has lasting value if it feeds into your quality management system. Every flagged deviation should:
- Trigger an automatic record — job, operator, timestamp, process parameters at time of deviation
- Link to the part serial number — for full traceability if a defect later appears in service
- Feed into CAPA workflows — root cause analysis and corrective action tracking
- Update the statistical baseline — so the acceptable process envelope tightens over time
HeatCore generates per-bead thermal records that are stored against the weld job and exportable to standard QMS formats. Our the HeatCore QMS workflow module can automatically open an NCR record when thermal anomaly counts exceed configurable thresholds — connecting process monitoring directly to corrective action workflows.
For more on how digital traceability supports ISO 3834 compliance, see digital welding quality records: WPS, PQR, and traceability.
Practical Implementation: What You Need
Deploying inline thermal weld porosity detection on an existing robotic cell typically requires:
- Thermal camera — spectral range matched to weld temperatures (typically 900–1600°C working range), frame rate ≥50 Hz for arc welding speeds
- Mounting hardware — torch-mounted or fixed-frame depending on robot geometry and joint access
- HeatCore AI edge device — processes the thermal stream at the cell, no cloud latency
- Baseline commissioning — 20-50 reference welds per joint type to establish the acceptable process envelope
- Integration interface — robot I/O for alert/pause signals, OPC-UA or REST API for MES connection
Typical commissioning time for a single robotic cell: 1-2 days on-site. See our monitoring products for the camera and edge-device options.
See Weld Porosity Detection in Action
Book a live demo of HeatCore on your weld joint type. We'll show you how thermal monitoring catches process deviations that produce porosity — in real time, on your material.
Book a HeatCore demoSummary
Weld porosity is one of the most costly and elusive defects in welding manufacturing. Traditional post-weld NDT finds porosity after the damage is done. Real-time thermal imaging with HeatCore shifts the detection window to during welding — catching the process conditions that produce porosity and enabling intervention before defects proliferate.
The result: fewer NCRs, smaller NDT backlogs, better ISO 3834 traceability, and a measurable reduction in rework cost. In high-volume production, the ROI is typically achieved within the first quarter of deployment.
Next step: Contact Therness to discuss your welding process and see a HeatCore demo on your specific joint type and material.
Therness solution: Welding monitoring system — Every weld inspected in the cycle, with defect flags and the ISO 3834 / ISO 17635 evidence kept per weld.