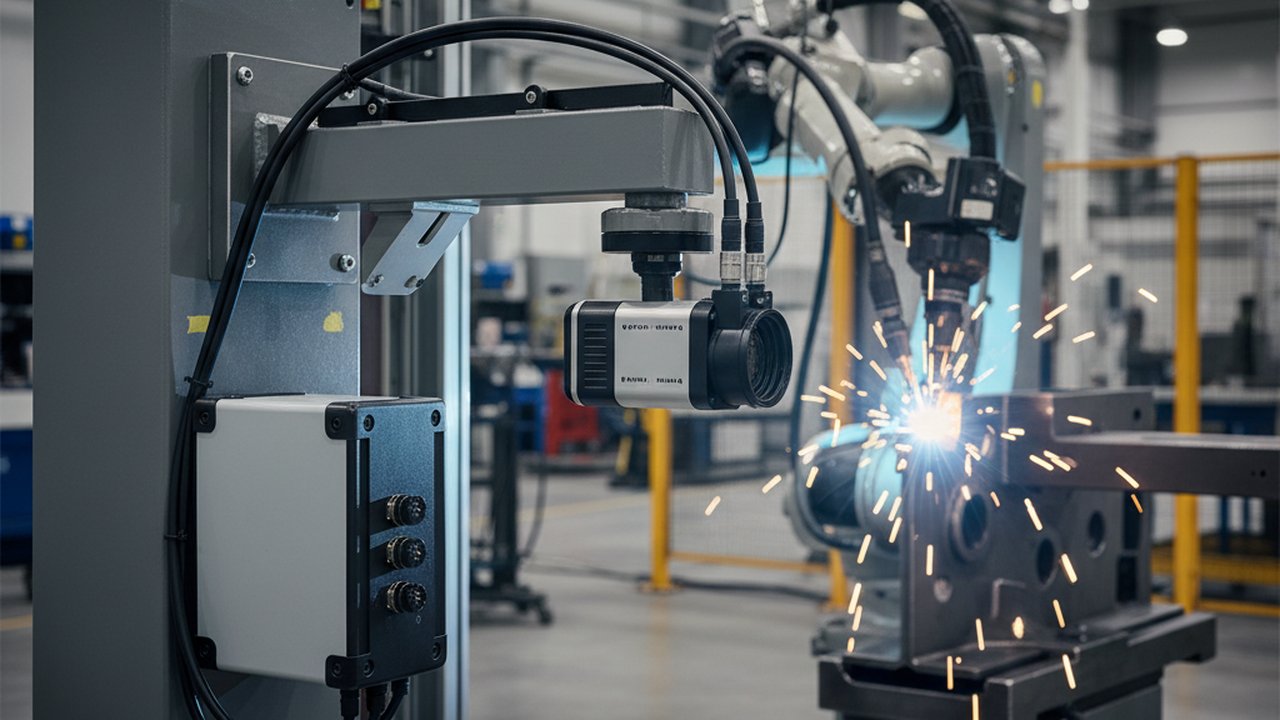
Weld bead geometry measurement is the cornerstone of structural integrity in critical welded components. From automotive body-in-white assemblies to pressure vessel pipelines, the dimensional characteristics of a weld bead directly correlate with mechanical performance, fatigue resistance, and regulatory compliance. Traditional post-weld inspection methods—visual testing, caliper measurements, and destructive cross-section analysis—introduce delays, create inspection bottlenecks, and cannot catch deviations during the welding process itself.
This comprehensive guide explores how modern manufacturers deploy weld bead geometry measurement using thermal imaging and laser profilometry to achieve real-time quality control, eliminate downstream rework, and satisfy stringent industry standards including ISO 5817:2023 and AWS D1.1/D1.1M:2025.
What Is Weld Bead Geometry Measurement?
Weld bead geometry measurement quantifies the dimensional characteristics of a deposited weld bead relative to the base material and joint design. The primary geometric parameters include:
- Bead Width — The lateral extent of the weld deposit across the joint
- Reinforcement Height — The distance from the base metal surface to the highest point of the weld crown
- Toe Angle — The angle formed between the weld face and the base metal at the weld toe
- Penetration Depth — The distance the weld metal extends into the root side of the joint
- Leg Length (for fillet welds) — The distance from the root to the toe along each member
These parameters determine load-bearing capacity, stress concentration factors, and susceptibility to defects like undercut, overlap, and incomplete fusion. For structural applications governed by ISO 5817:2023, geometric tolerances are specified by quality level—B (stringent), C (intermediate), or D (moderate)—based on application criticality.
Why Real-Time Geometry Measurement Matters
The Cost of Post-Weld Defects
Manual inspection after welding completion creates a fundamental problem: defects discovered at final inspection require complete rework, grinding, or part rejection. In automotive manufacturing, a single defective body-in-white weld can cascade through downstream assembly stages before detection, compounding material waste and production delays.
Process Control vs. Product Inspection
Statistical process control (SPC) principles distinguish between product inspection (checking the output) and process monitoring (controlling the input). Real-time weld bead geometry measurement enables true process control by detecting deviations as they form, allowing immediate parameter adjustments or automatic rejection of non-conforming parts before value-added operations continue.
Regulatory and Customer Requirements
Automotive OEMs increasingly mandate inline weld monitoring as part of production part approval process (PPAP) submissions. Learn more about welding PPAP requirements in our guide on PPAP weld traceability for automotive suppliers.
Methods for Measuring Weld Bead Geometry
Contact Methods: Limitations and Drawbacks
Traditional contact measurement techniques include:
| Method | Accuracy | Speed | Inline Capability |
|---|---|---|---|
| Vernier calipers | ±0.1 mm | Manual only | No |
| Replica molding + microscopy | ±0.05 mm | 5–15 min per weld | No |
| Destructive cross-section | Reference standard | 30–60 min per sample | No |
| Contact profilometers | ±0.01 mm | 2–5 min per scan | Limited |
The fundamental limitation of contact methods is their offline nature. They provide accurate snapshots but cannot track geometric evolution during welding or catch transient deviations caused by arc instability, wire feed variation, or joint fit-up changes.
Laser Triangulation Profilometry
Laser triangulation profilometers project a laser line onto the weld surface and capture the reflected profile using a position-sensitive detector. By sweeping the laser across the weld bead or using a 2D laser pattern, the system reconstructs a 3D point cloud representing the bead cross-section.
Advantages:
- Sub-millimeter accuracy (typically ±0.05 mm)
- High spatial resolution (10–100 µm point spacing)
- Insensitive to arc light interference when properly filtered
- Direct geometric measurement independent of material emissivity
Limitations:
- Requires clear optical access to the weld zone
- Surface oxidation and spatter can obscure the laser line
- Limited field of view requires precise sensor positioning
Thermal Imaging for Bead Geometry
Infrared thermography offers an alternative approach to weld bead geometry measurement that leverages the thermal signature of the welding process itself. As the weld pool solidifies and cools, the temperature distribution encodes information about bead dimensions.
Thermal cameras with appropriate spatial resolution (typically 640×480 or higher) and frame rates (50–200 Hz for MIG/MAG, 500+ Hz for laser welding) capture the cooling profile across the weld bead. Advanced algorithms correlate thermal gradients with geometric features:
- Bead width correlates with the lateral extent of the cooling isotherms
- Reinforcement height affects the cooling rate at the bead center
- Toe angle influences the thermal transition at the weld toe
Our HeatCore AI thermal monitoring system combines high-resolution thermal imaging with real-time analytics to extract geometric parameters without laser illumination requirements.
Sensor Fusion: The Optimal Approach
The most robust weld bead geometry measurement implementations fuse data from multiple sensing modalities. Thermal imaging provides continuous coverage and process insight, while laser profilometry offers direct dimensional calibration. Acoustic emissions can further characterize penetration and fusion quality. Read about comprehensive sensor fusion weld quality monitoring strategies in our dedicated guide.
Critical Geometric Parameters and Their Significance
Bead Width Control
Excessive bead width indicates excessive heat input, which can cause:
- Base metal distortion and residual stress
- Wide heat-affected zones (HAZ) with reduced toughness
- Increased susceptibility to solidification cracking
Insufficient bead width suggests inadequate heat input or travel speed, risking:
- Lack of fusion at joint sidewalls
- Insufficient throat thickness for load-bearing capacity
- Incomplete joint penetration
For GMAW (MIG/MAG) welding of carbon steel, typical bead width specifications range from 8–15 mm depending on joint preparation and wire diameter. Our GMAW MIG welding quality monitoring guide covers process parameter relationships in detail.
Reinforcement Height Optimization
Reinforcement (excess weld metal above the base surface) provides additional throat thickness for fillet welds and root protection for butt welds. However, excessive reinforcement creates stress concentration at the weld toe, reducing fatigue life.
ISO 5817:2023 specifies maximum reinforcement limits by quality level:
- Quality Level B: max 1 mm + 0.1b (b = bead width), ≤ 3 mm absolute
- Quality Level C: max 1.5 mm + 0.15b, ≤ 4 mm absolute
- Quality Level D: max 2 mm + 0.2b, ≤ 5 mm absolute
Real-time reinforcement monitoring enables immediate voltage or wire feed adjustments to maintain specification compliance.
Toe Angle and Stress Concentration
The weld toe angle significantly influences fatigue performance. Sharp transitions (small toe angles) concentrate stress and initiate crack propagation under cyclic loading. Smooth transitions distribute stress more uniformly.
For critical fatigue applications—bridge structures, offshore platforms, wind turbine towers—toe blending or grinding may be specified. Real-time toe angle measurement identifies non-conforming profiles immediately, eliminating the cost of post-weld conditioning on acceptable welds or missing inadequate blending before components ship.
Implementing Real-Time Geometry Measurement
System Architecture
A complete inline weld bead geometry measurement system comprises:
-
Sensing Layer — Thermal cameras, laser profilometers, and/or vision cameras positioned to capture the weld zone without interference from spatter shielding or fume extraction
-
Edge Processing — Industrial PCs or embedded AI accelerators running real-time image processing and geometry extraction algorithms
-
Integration Layer — Communication interfaces (OPC-UA, MQTT, REST APIs) connecting measurement data to MES, SCADA, and quality databases
-
Visualization Layer — Operator dashboards showing real-time geometry traces, SPC charts, and pass/fail indicators
Compare options across the Therness monitoring product range to match thermal or laser sensing to your line.
Learn more about welding MES integration in our welding data historian MES integration guide.
Calibration and Traceability
Geometric measurement systems require periodic calibration against certified reference artifacts. For thermal imaging-based systems, emissivity calibration on representative material samples ensures temperature-to-geometry correlation accuracy.
Measurement uncertainty budgets must account for:
- Sensor resolution and optical distortion
- Thermal gradient interpretation algorithms
- Part-to-part emissivity variation
- Ambient temperature and airflow effects
ISO 17662:2016 provides guidance on calibration, verification, and validation of welding equipment including monitoring systems. For comprehensive calibration protocols, see our ISO 17662 welding monitoring calibration guide.
Data Integration and Automated Response
Real-time geometry measurement creates maximum value when integrated with automated response systems:
-
Adaptive Process Control — Closed-loop adjustment of welding parameters (voltage, wire feed, travel speed) based on measured geometry trends
-
Automatic Part Sorting — Physical diversion of non-conforming parts from the production flow
-
Predictive Maintenance — Correlation of geometry drift patterns with consumable wear, torch misalignment, or fixture degradation
Applications by Industry
Automotive Body-in-White
Resistance spot welding and arc welding of automotive structures demand consistent bead geometry for crashworthiness and dimensional stability. The resistance spot welding monitoring guide covers BIW-specific requirements, while arc-welded chassis components benefit from continuous geometry tracking during multi-pass sequences.
Pressure Vessels and Piping
ASME Boiler and Pressure Vessel Code Section IX and ISO 3834-2:2021 welding quality requirements mandate documented evidence of procedure compliance. Real-time geometry measurement generates objective records supporting weld procedure qualification records (WPQR) and production quality documentation.
See our pressure vessel welding quality monitoring guide for comprehensive coverage of compliance requirements.
Shipbuilding and Offshore
Heavy structural welding in shipyards involves thick sections, multi-pass sequences, and challenging access conditions. Thermal imaging-based geometry measurement accommodates the harsh environments and varying joint configurations characteristic of marine fabrication.
For multi-pass welding applications, our multi-pass welding thermal monitoring guide explains layer-by-layer quality strategies.
ROI and Implementation Considerations
Quantifying the Business Case
Real-time weld bead geometry measurement investments deliver returns through multiple value streams:
| Value Stream | Typical Impact | Measurement Approach |
|---|---|---|
| Scrap reduction | 30–50% decrease | Defects caught before downstream operations |
| Rework elimination | 60–80% reduction | In-process correction vs. post-weld repair |
| Inspection labor | 40–60% decrease | Automated measurement replaces manual sampling |
| Customer complaints | 80%+ reduction | Objective data proving specification compliance |
| Cycle time | 5–15% improvement | Elimination of inline inspection bottlenecks |
Implementation Roadmap
Successful deployments typically follow a phased approach:
- Pilot Phase (4–8 weeks) — Single station deployment on a representative joint geometry
- Validation Phase (4–6 weeks) — Correlation study against destructive cross-sections and customer approval
- Expansion Phase (8–12 weeks) — Rollout to additional stations and joint types
- Optimization Phase (ongoing) — SPC limits refinement and integration with broader quality systems
Conclusion
Weld bead geometry measurement has evolved from offline sampling to continuous real-time monitoring, enabled by advances in thermal imaging resolution, laser profilometry accuracy, and AI-driven analytics. Manufacturers implementing these technologies achieve measurable reductions in scrap and rework while generating the documented evidence required for automotive PPAP, pressure equipment PED compliance, and structural fabrication certification.
The transition from product inspection to process control represents a fundamental shift in welding quality management—one that aligns with Industry 4.0 principles and delivers competitive advantage in demanding manufacturing environments.
Watch: HeatCore AI — Real-Time Circular Weld Bead Tracking & Thermal Measurement
Ready to implement real-time weld bead geometry measurement?
Schedule a consultation to discuss your application requirements and evaluate inline monitoring solutions for your welding processes.
Book a demoTherness solution: Welding camera — Thermal and high-speed imaging that watches the arc, the pool and the cooling seam while the weld is made.