Weld defect detection software is the decision layer in every automated inspection chain — the component that determines whether a weld is accepted, rejected, or flagged for review before the part exits the cell. The sensor captures data; the software decides what it means. Choosing the right system requires understanding what it actually does, what it cannot do, and what integration complexity is hiding behind vendor demos.
This guide covers everything quality managers, welding engineers, and plant managers need to evaluate automated weld inspection software for production environments in 2026: core features, integration architecture, AI capabilities and their documented limits, common failure modes, and the validation protocol that separates a commissioned system from an installed risk.
Key takeaways
- Weld defect detection software classifies discontinuities from sensor data (vision, thermal, arc signal) in real time and logs each result against a weld ID for downstream traceability.
- The sensor determines which defects are physically detectable; the software determines whether detectable anomalies are correctly classified. Confusing the two is the most common procurement error.
- Critical features: configurable thresholds tied to codes (see the full ISO 5817 acceptance criteria guide), weld ID input from PLC or scanner, OPC-UA or Modbus parameter export, and exportable traceability records compatible with ISO 3834-2.
- AI-based detection is production-ready for repeatable geometries and trained defect categories. It is not self-validating — commissioning always requires a parallel inspection phase with certified VT inspectors.
- The most common production failure modes are false-positive drift, fixture creep, training data mismatch on grade swaps, and weld ID dropout.
- Validation minimum: 200+ welds inspected in parallel by the software and certified inspectors. Target sensitivity equal to or better than inspector reference; specificity above 85%.
- The integration scope — not the software licence price — is typically the primary cost and timeline driver.
Table of Contents
- What Weld Defect Detection Software Actually Does
- Core Features Checklist for Quality Engineers
- Sensor-to-Software Integration Architecture
- AI Weld Defect Detection: What It Delivers vs What It Claims
- Common Failure Modes and How to Fix Them
- Step-by-Step Validation Before Production Go-Live
- FAQ
What Weld Defect Detection Software Actually Does
Weld defect detection software sits between physical sensors and the production decision. Its job is to receive sensor output — pixel arrays from a weld inspection camera, temperature maps from a thermal sensor, current and voltage traces from an arc monitor, or scan files from a radiographic or ultrasonic system — and translate that data into a pass/fail judgement with an associated defect classification.
That sounds straightforward. In practice it involves several distinct functions that vendors bundle, split, or rebrand depending on their architecture:
Data acquisition: buffering and timestamping sensor streams, synchronised to weld events from the PLC or robot controller. Without synchronisation, defect location within the weld seam is lost. A mismatch of even 50 milliseconds between the weld event signal and the sensor capture timestamp can shift the flagged location by 5–10 mm in a fast-travel application — enough to confuse rework personnel or invalidate traceability records.
Preprocessing: noise filtering, background subtraction, and normalisation to compensate for arc brightness, ambient light variation, and sensor ageing. This is where systems diverge most in field performance — the same underlying algorithm produces substantially different results depending on preprocessing quality, and vendors rarely document the preprocessing pipeline in their technical datasheets.
Feature extraction and classification: identifying image regions or signal segments that correspond to weld discontinuities — porosity, lack of fusion, undercut, cracking, excessive spatter, burn-through — and classifying each anomaly type. Threshold-based systems compare measurements against fixed acceptance limits; AI-based systems use learned models applied to feature vectors or raw images.
Result logging and alerting: writing a per-weld record containing weld ID, timestamp, defect type and location, verdict, and the associated sensor data snapshot. Generating operator alerts when a weld fails. Triggering cell stop signals for critical defects in high-integrity applications.
Reporting and export: SPC control charts, shift summaries, NCR records, and weld data sheets for ISO 3834-2 documentation packages. This output layer is what quality auditors and customers see, so its completeness determines whether the system satisfies regulatory and contractual obligations.
Understanding these five functions as separate modules — and confirming which ones are covered in any given product — is the first step in a rigorous evaluation.
Core Features Checklist for Quality Engineers
Before issuing a vendor RFQ, confirm each item below is explicitly supported and demonstrated — not listed in a product brochure but not available in the standard configuration. Many systems cover the first half of this list and omit the second.
| Feature | Why it matters |
|---|---|
| Configurable acceptance thresholds per WPS | One system must serve multiple procedures and codes (ISO 5817, AWS D1.1, EN 15085) without manual reconfiguration per shift |
| Weld ID input (barcode, QR, PLC tag) | Without weld ID linkage, defect records cannot be traced to a specific joint — traceability collapses for the entire assembly |
| OPC-UA or Modbus output | Integration with robot controllers, PLCs, and MES/ERP requires standard industrial protocols; proprietary protocols are integration debt |
| Per-defect classification, not only pass/fail | A binary verdict is not actionable; knowing whether the failure is undercut vs. porosity drives a different root-cause investigation |
| Multi-sensor input correlation | Production cells rarely have a single sensor; software must correlate data from multiple sources into one weld record |
| Role-based access control | Quality engineers, operators, and auditors need different permission levels; immutable audit logs are a regulatory requirement |
| Exportable data in open formats (CSV, JSON, XML) | Proprietary formats create vendor lock-in and prevent ERP integration or future migration |
| Offline review and annotation mode | Re-inspection of archived sensor data for borderline weld disposition and for training new operators |
| Calibration and threshold management with version control | Documented calibration workflow with versioned threshold sets is required for ISO 9712-compliant deployments |
Evaluation tip: request a live demonstration on your part geometry and your defect categories, not on the vendor’s reference coupon. If the vendor cannot provide this before contract, treat it as a risk flag.
Sensor-to-Software Integration Architecture
The integration stack for weld defect detection software has four layers. Understanding each before vendor selection prevents the scope surprises that most frequently extend project timelines.
Layer 1 — Sensor interface: the software must accept the exact output format of your sensor. A thermal weld monitoring camera outputs radiometric frame streams in a specific protocol (GigE Vision, Camera Link, USB3 Vision, or proprietary SDK). A vision camera outputs raw or compressed image frames. An arc monitor outputs voltage/current time series in a different format entirely. Each requires a matching driver or API layer. Ask vendors for their confirmed sensor compatibility list with protocol versions — not a generic “we support cameras” statement.
Layer 2 — Process synchronisation: weld start and end signals from the robot controller or PLC synchronise sensor capture to the weld event. Integration via digital I/O (24V trigger), OPC-UA subscription, or Modbus is typical. This layer defines how accurately defect location maps to seam position. Define the synchronisation approach in your scope of supply before signing the contract — retrofitting synchronisation after deployment is expensive and often requires new wiring.
Layer 3 — Weld ID input: each weld must be tagged with a joint identifier from the production system. This arrives via a barcode scanner at the fixture, a QR code on the part carrier, or a PLC tag written from the job routing system at weld start. Confirm the software handles your existing ID source via the same protocol — do not accept “we can add that interface” without a written delivery commitment.
Layer 4 — Downstream export: passing defect data to MES, ERP, or quality management systems requires either a push (software writes to a shared database or calls an API) or a pull (MES queries the inspection system on a schedule). Define the data model before integration starts — mandatory fields, field types, timestamp format, defect code vocabulary. Retrofitting the data model after the first NCR hits the ERP is the most common cause of project overruns.
A fully integrated welding monitoring system that covers all four layers from a single vendor simplifies commissioning but concentrates supplier dependency. A best-of-breed approach using open protocols (OPC-UA on Layer 2, REST/JSON on Layer 4) preserves flexibility at the cost of internal integration ownership. Choose based on your team’s integration capability, not vendor preference.
For deeper coverage of PLC wiring, synchronisation protocols, and data pipeline patterns for production inspection cameras, see Welding Camera PLC Integration: Wiring, Sync & Data Pipeline.
AI Weld Defect Detection: What It Delivers vs What It Claims
AI-based weld defect detection — convolutional neural networks and transformer models applied to weld image or thermal data — has moved from research prototypes to production deployments in high-volume manufacturing over the past four years. Understanding what AI genuinely provides prevents both over-trust and blanket dismissal.
Where AI detection works well
Repeatable geometries with consistent fixturing: robotic MIG/MAG fillet welds on a single part family, laser welds on battery tabs, resistance spot welds on automotive stampings. In these environments, a well-trained model achieves sensitivity comparable to Level 2 VT inspectors on the defect categories it was trained on. The repeatability is what makes the training data representative.
Process parameter anomaly detection: AI models trained on arc signal time series detect short-circuit events, wire burn-back events, shielding gas interruptions, and contact tip degradation with high precision. This complements image-based defect detection rather than replacing it — process anomalies detected early prevent surface defects from forming.
High-throughput 100% coverage: at frame rates above 60 fps, AI classification enables full inline inspection on production lines running at cycle times that make manual inspection infeasible. The business case rests on replacing post-weld NDT sampling with 100% real-time coverage, reducing both escape rate and re-inspection cost.
Where AI detection has documented limits
Novel geometries or material grades outside the training distribution. A model trained on S355 structural steel will underperform on S700 high-strength steel without retraining. This is not a software defect — it is a fundamental property of discriminative learned models. It means every production change that affects weld geometry or bead morphology is a potential model validity event. See real-time AI approaches for weld porosity detection for how this limits thermal detection of near-surface subsurface defects.
Subsurface defects beyond the thermal diffusion depth. AI applied to surface or thermal images cannot detect buried porosity or internal lack-of-fusion that does not produce a distinguishable surface or near-surface thermal signature. Claims to the contrary require very specific validated physics-based models, not generalised pattern recognition.
Self-certification. No current AI system can independently assert that its detection performance meets a specific code acceptance level (ISO 5817 Level B, for example) without external validation evidence. That assertion requires a labelled dataset, a validation protocol, and human-reviewed results.
Key evaluation question: ask vendors for their validation dataset specification — number of welds, defect categories covered, alloy grades, joint types, and the measured sensitivity and specificity on a held-out test set. A vendor who cannot provide this in a structured document is not production-ready regardless of their marketing claims.
The International Institute of Welding and TWI — The Welding Institute have published guidelines on AI qualification criteria for weld inspection systems. Review both before finalising your vendor qualification criteria.
For a cross-modal comparison of thermal, vision, and acoustic AI approaches, see AI Weld Defect Detection: Thermal vs. Vision vs. Acoustic.
Common Failure Modes and How to Fix Them
Six months after go-live, weld inspection software installations fail for predictable operational reasons — not software bugs, but deployment gaps and process drift that commissioning did not account for.
False-positive rate drift. Thresholds calibrated at commissioning become miscalibrated as consumables age (wire diameter tolerance tightens, contact tip wears), shielding gas flow varies seasonally with ambient temperature, or welding procedures are silently adjusted by operators. The false-positive rate climbs, operators begin ignoring alerts, and the system is functionally bypassed while appearing active in dashboards.
Fix: monthly threshold verification against a fixed set of reference welds with known ground-truth verdicts. If the false-positive rate on the reference set exceeds 10%, trigger a full recalibration cycle before the next production shift.
Fixture creep. Vibration from the weld cell gradually shifts camera mounting positions over weeks, changing the sensor field of view and invalidating spatial calibration. Defects at the seam edge migrate outside the detection zone without any software alarm — the system still runs and logs, but it is no longer inspecting what it was calibrated to inspect.
Fix: mechanical lock-down of all camera and sensor mounts with vibration-damped fixturing and witness-mark alignment indicators. Weekly fixture verification using a calibration target placed at the weld position before the first shift.
Training data mismatch. A material grade change, gauge change, or filler wire specification change in the production schedule introduces weld bead geometry and spatter patterns the model was not trained on. Defect rate appears to drop — not because quality improved but because the model no longer recognises the new anomaly signatures as anomalies.
Fix: maintain a change log of all material, process, and consumable changes. Define a model validation trigger: any change that affects bead morphology or thermal emission requires a validation run against seeded defect samples before production restart. See weld quality monitoring fundamentals for process variable interaction effects.
Weld ID dropout. Barcodes obscured by spatter, QR codes misread at angle, or PLC tag write failures create welds logged with no valid ID. These welds cannot be retrieved for disposition, traced in the assembly record, or included in traceability packages for customer audit.
Fix: enforce a hard-fail at the PLC level — the cell does not start the weld if weld ID has not been confirmed received by the inspection system. Do not log unidentified welds as passed. This requires integration depth that must be specified in the original scope.
Alert fatigue. High false-positive rates cause operators to stop responding to failure alerts within weeks of go-live. The detection system remains active and logs results, but the human response chain has broken. Management dashboards show system uptime; quality engineers see rising escape rate at final inspection.
Fix: track operator response rate to alerts as a primary KPI alongside the false-positive rate itself. Define a response-rate floor (typically 80%) below which an automatic threshold review is triggered. Alert fatigue is a system calibration failure, not an operator compliance failure.
Step-by-Step Validation Before Production Go-Live
Validation is not optional documentation — it is the evidence that the system meets its detection performance specification before it becomes the quality gate. Skipping it transfers liability from the vendor to the production quality system.
Step 1: Define validation scope and acceptance criteria. Identify the weld types, joint configurations, material grades, and defect categories that will be in scope. Specify the acceptance criteria thresholds applicable to each procedure (for example, ISO 5817 Level B for structural welds, or AWS D1.1 Section 8 for structural steel). Document the validation plan and obtain sign-off from quality and engineering before sample preparation begins.
Step 2: Prepare reference samples. Commission weld samples from the production process or from a qualified welding procedure — minimum 50 positive-defect samples per target defect category, plus at least 150 clean-weld negative samples. Have a certified NDT inspector, qualified per ISO 9712 and EN ISO 17637 for visual testing (or per EN ISO 17636 for radiographic confirmation), classify each sample independently. These classifications are the ground truth. Do not share them with the software team until after the software has made its classifications.
Step 3: Run the parallel inspection phase. Process the reference samples through the production line under software monitoring. The software classifies each weld in real time. Inspectors make their independent classifications without access to software verdicts. Keep both result sets sealed until the full sample batch is complete.
Step 4: Calculate performance metrics. Compare software verdicts against inspector ground truth:
- Sensitivity (recall): true positives divided by total actual positives. Target: equal to or better than the reference inspector for each defect category.
- Specificity: true negatives divided by total actual negatives. Target: above 85%.
- False-positive rate: false positives divided by total welds inspected. Target: below 15% on the production-representative sample.
Step 5: Iterate if targets are not met. Adjust thresholds for threshold-based systems. For AI systems, retrain on the specific failing categories using the new labelled samples, then re-run from Step 3 using a fresh sample set. Never reuse the same samples for both retraining and validation — doing so introduces data contamination that invalidates the performance estimate.
Step 6: Document and sign off. Produce a validation report including the plan, sample inventory, inspector qualifications, inspection methodology, performance metrics table, and any threshold or model changes made during iteration. The quality authority signs the report. This document is the production authorisation record and the starting point for periodic re-validation triggered by material or process changes.
ASME Boiler and Pressure Vessel Code Section IX and AWS D1.1 Structural Welding Code — Steel each specify their own acceptance criteria frameworks relevant to the validation scope. The NIST Engineering Laboratory has published benchmarking methodologies for manufacturing inspection AI that provide additional reference structure for organisations establishing internal AI qualification protocols.
For a comprehensive foundation on real-time monitoring modalities and detection approach selection, see Weld Quality Monitoring 101: Real-Time AI Methods.
For deployments combining controlled excitation, synchronized capture, and reporting, review a hardware-plus-software thermal inspection line as a distinct system scope.
FAQ
What does weld defect detection software do?
It processes sensor data — thermal, vision, acoustic, or arc signal — to identify anomalies during or after welding that indicate defects such as porosity, lack of fusion, cracking, or excessive spatter. The software classifies anomalies, generates alerts, and logs records for traceability. The sensor determines which defect categories are physically detectable; the software determines whether detectable anomalies are correctly classified.
What is the difference between weld defect detection software and weld quality software?
Weld defect detection software focuses on identifying specific discontinuities in real time or from NDT scan data. Weld quality software is a broader category that includes defect detection plus parameter monitoring, procedure compliance, reporting, and ISO 3834 documentation management. In procurement scope documents, distinguish between the two — a system that monitors parameters and logs data is not the same as one that autonomously classifies discontinuities against acceptance criteria.
Can AI weld defect detection software replace manual visual inspection?
For routine production welds on repeatable geometries, AI-based systems can equal or exceed trained inspector performance on the defect categories covered by their training data. They do not replace inspection for novel geometries, complex joint configurations, or applications requiring witness sign-off under codes like ASME Section IX or EN ISO 3834-2. AI detection supplements and accelerates human inspection decisions; it does not eliminate the need for human-qualified oversight in regulated applications.
What integration does weld defect detection software require?
Minimum: sensor output (camera, pyrometer, or arc monitor) plus weld ID input from the PLC or barcode scanner. Typical production integration adds robot/PLC parameter streams via OPC-UA or Modbus, ERP export for NCR traceability, and SPC dashboard output. Each integration layer is a deployment milestone with its own commissioning time. Scope all four layers before vendor selection — integration cost frequently exceeds software licence cost by a factor of two or more.
How does weld defect detection software handle ISO 5817 or AWS D1.1 acceptance criteria?
Better systems allow per-procedure threshold sets mapped to code acceptance limits. The software flags any measurement that breaches a threshold and tags the weld record with the violated criterion and the applicable code clause reference. This requires calibration against known defect samples at each acceptance level before production use. For the full discontinuity limits table, see the ISO 5817 acceptance criteria reference guide.
What are the most common failure modes of weld inspection software?
False-positive rate drift (thresholds miscalibrate as consumables age), fixture creep (camera field of view shifts from vibration over weeks), training data mismatch (model underperforms on material grade swaps), and weld ID dropout (barcodes missed, welds logged without traceability). Each has a defined fix — see the Common Failure Modes section above for root causes and corrective protocols.
How do I validate weld defect detection software before production use?
Run a parallel inspection phase: the software classifies welds in real time while certified VT inspectors classify the same welds independently. Compare results over 200 or more welds. Target: software sensitivity equal to or better than the inspector reference; specificity above 85%. Document the validation per ISO 9712 qualification protocols and obtain quality authority sign-off before production start.
What reporting does weld defect detection software generate?
Standard outputs include per-weld pass/fail records with timestamp and weld ID, defect type and location data, trend charts across shifts and weeks, and SPC control charts for process parameters. Systems compliant with EN ISO 3834-2 generate weld data sheets directly from logged records, substantially reducing manual documentation effort and simplifying customer audit package preparation.
Evaluate Weld Defect Detection for Your Production Line
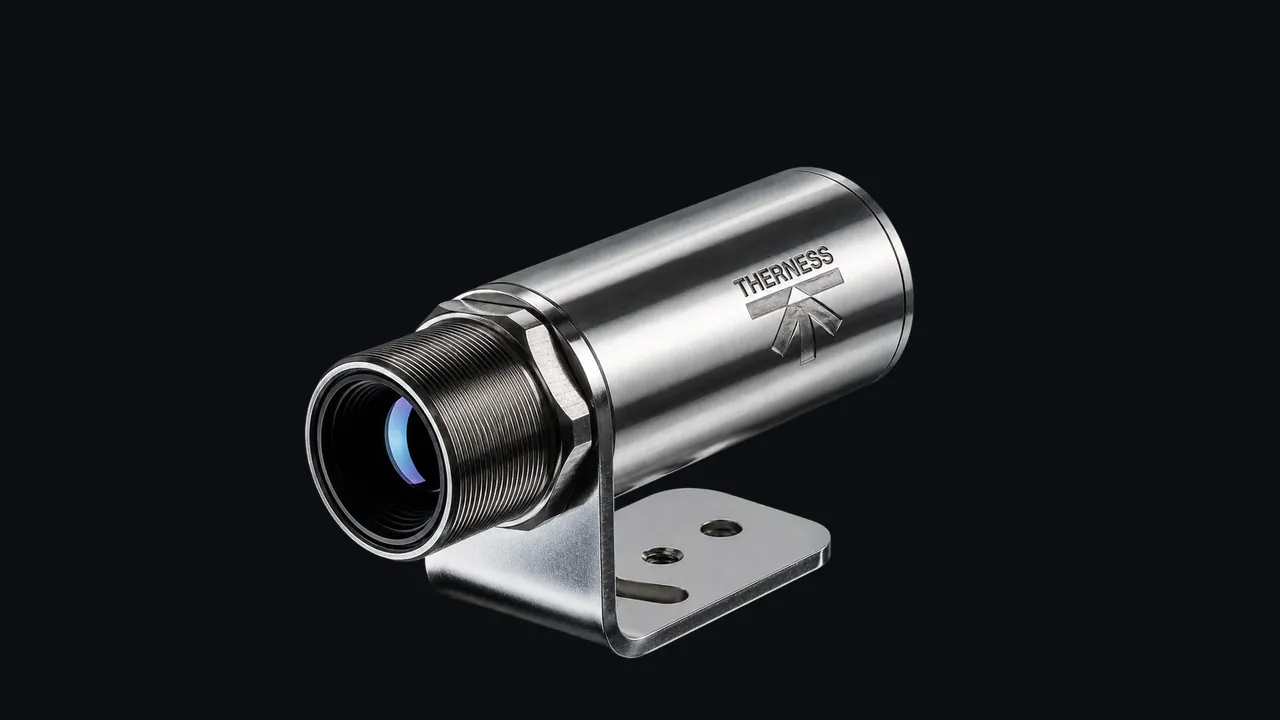
Therness inspection systems combine thermal and vision sensing with real-time defect classification software built for production environments. Talk to our engineering team about your application and validation requirements.
Request a DemoTherness solution: Welding monitoring system — Every weld inspected in the cycle, with defect flags and the ISO 3834 / ISO 17635 evidence kept per weld.
Frequently Asked Questions
What does weld defect detection software do?
It processes sensor data — thermal, vision, acoustic, or arc signal — to identify anomalies during or after welding that indicate defects such as porosity, lack of fusion, cracking, or excessive spatter. The software classifies anomalies, generates alerts, and logs records for downstream traceability.
What is the difference between weld defect detection software and weld quality software?
Weld defect detection software focuses on identifying specific discontinuities in real time or from NDT scan data. Weld quality software is a broader category that includes defect detection plus parameter monitoring, procedure compliance, reporting, and ISO 3834 documentation management. Some vendors use the terms interchangeably; in procurement scope documents, distinguish between the two explicitly.
Can AI weld defect detection software replace manual visual inspection?
For routine production welds on repeatable geometries, AI-based systems can equal or exceed trained inspector performance on defect categories covered by their training data. They do not replace inspection for novel geometries, complex joint configurations, or applications requiring witness sign-off under codes like ASME Section IX or EN ISO 3834-2.
What integration does weld defect detection software require?
Minimum: sensor output (camera, pyrometer, or arc monitor) plus weld ID input from the PLC or barcode scanner. Typical production integration adds robot/PLC parameter streams via OPC-UA or Modbus, ERP export for NCR traceability, and SPC dashboard output. Each integration layer is a deployment milestone and should be scoped before vendor selection.
How does weld defect detection software handle ISO 5817 or AWS D1.1 acceptance criteria?
Better systems allow per-procedure thresholds mapped to code acceptance limits. The software flags any weld parameter or image measurement that breaches the threshold and tags the weld record with the violated criterion and the applicable code clause. This requires calibration — the system must be validated against known defect samples at each acceptance level before production use.
What are the most common failure modes of weld inspection software?
False-positive rate drift (threshold not recalibrated as consumables age), fixture creep (camera field of view shifts from vibration), training data mismatch (model underperforms on a grade swap), and weld ID dropout (barcodes missed, welds logged without traceability). Each requires a defined monitoring and correction protocol.
How do I validate weld defect detection software before production use?
Run a parallel inspection phase: the software judges in real time while certified VT inspectors independently classify the same welds. Compare over 200 welds minimum. Target: software sensitivity equal to or better than the inspector reference; specificity above 85%. Document the validation per ISO 9712 personnel qualification protocols and sign off before production start.
What reporting does weld defect detection software generate?
Standard outputs include per-weld pass/fail records with timestamp and weld ID, defect type and location data, trend charts across shifts and weeks, and SPC control charts for process parameters. ISO 3834-2 compliant systems generate weld data sheets directly from logged records, reducing manual documentation effort substantially.