Welding process capability analysis is the foundation of modern quality assurance in manufacturing. For automotive Tier 1 and Tier 2 suppliers, demonstrating Cpk ≥ 1.33 and Ppk ≥ 1.67 isn’t just a regulatory requirement—it’s a competitive necessity that separates world-class manufacturers from those constantly fighting scrap and rework.
This guide explains everything quality managers and welding engineers need to understand about process capability indices, their implementation in welding operations, and how real-time thermal monitoring enables automated statistical process control (SPC) that keeps your processes centered and capable.
What Is Welding Process Capability?
Process capability quantifies how well your welding process meets specification limits consistently. Unlike simple pass/fail inspection, capability analysis evaluates the statistical distribution of your process output—whether that’s bead width, penetration depth, heat input, or thermal profile consistency.
A capable welding process produces parts within specification limits with minimal variation, achieving predictable quality that auditors and customers can verify through data rather than samples.
The two primary indices used in welding quality management are:
Cpk (Process Capability Index)
Cpk measures short-term process capability using within-subgroup variation. It answers the question: “If the process stays exactly as it is right now, how capable is it?” Cpk accounts for both process spread and centering relative to specification limits.
Industry standards for Cpk in welding applications:
- Cpk ≥ 1.33: Minimum acceptable for most automotive applications
- Cpk ≥ 1.67: Required for safety-critical welds (chassis, structural components)
- Cpk ≥ 2.00: Six Sigma level, typical for aerospace and medical device welding
Ppk (Process Performance Index)
Ppk measures long-term process performance using overall variation (both within-subgroup and between-subgroup). It reflects what your customers actually receive over extended production runs, including setup changes, material lot variations, and operator shifts.
Ppk is always equal to or lower than Cpk. The gap between them indicates process stability:
- Small gap (Ppk ≈ Cpk): Stable, predictable process
- Large gap (Ppk much less than Cpk): Unstable process with significant variation sources
Why Process Capability Matters for Welding
Welding presents unique challenges for capability analysis due to its inherent variability. Heat input fluctuations, joint fit-up inconsistencies, shielding gas variations, and electrode wear all contribute to process spread that must be understood and controlled.
PPAP Requirements for Automotive Suppliers
The AIAG PPAP manual requires initial process studies demonstrating capability for all critical characteristics. For welded components, this typically includes:
- Weld bead dimensions (width, height, penetration)
- Heat input calculations
- Interpass temperature compliance
- Mechanical property verification (tensile, bend test results)
Without documented Cpk/Ppk values, your PPAP submission will fail customer review. The fourth edition specifically mandates capability studies for special characteristics designated by the customer or via PFMEA analysis.
Cost of Poor Capability
A process with Cpk = 0.74 (approximately 3.5 Sigma) produces thousands of defects per million opportunities. In welding operations, this translates to:
- Excessive scrap and rework costs
- Delayed deliveries and customer penalties
- Increased inspection burden
- Potential liability from field failures
- Audit findings and corrective action requirements
Improving from Cpk 0.74 to 1.33+ typically reduces defect rates by 95%+ while cutting quality-related costs by 40-60%.
Calculating Process Capability for Welding Parameters
Data Collection Requirements
Accurate capability analysis requires statistically valid sample sizes. For welding processes, collect data across:
- Multiple production shifts (captures operator/setup variation)
- Different material lots and suppliers
- Environmental conditions (temperature, humidity)
- Equipment wear states (new vs. worn electrodes, nozzles)
Minimum 100 measurements distributed across these conditions provide reliable Ppk estimates. For Cpk, subgroup sizes of 5 with 20+ subgroups are standard.
Critical Welding Parameters to Monitor
Modern welding quality monitoring systems track multiple parameters simultaneously:
| Parameter | Specification | Measurement Method | Capability Target |
|---|---|---|---|
| Bead Width | ±0.5 mm | Laser profilometry | Cpk ≥ 1.33 |
| Penetration Depth | Per WPS | Ultrasonic/thermal | Cpk ≥ 1.67 |
| Heat Input | ±10% | Voltage × Current / Travel Speed | Cpk ≥ 1.33 |
| Interpass Temperature | Max 250°C | Thermal imaging | Cpk ≥ 1.33 |
| Cooling Rate | Per WPS | Thermal profile analysis | Cpk ≥ 1.33 |
Capability Calculation Formula
For normally distributed data:
Cpk = min[(USL - μ) / 3σ, (μ - LSL) / 3σ]

Ppk = min[(USL - X̄) / 3s, (X̄ - LSL) / 3s]
Where:
- USL/LSL = Upper/Lower Specification Limit
- μ = process mean (short-term, within-subgroup)
- X̄ = overall process mean
- σ = short-term standard deviation (within-subgroup)
- s = long-term standard deviation (overall)
Implementing SPC in Welding Operations
Statistical Process Control transforms welding from an art into a data-driven science. Real-time SPC identifies process drift before it produces defects, enabling proactive rather than reactive quality management.
Control Chart Types for Welding
X-bar and R Charts: Monitor average values and ranges for continuous variables like bead width or heat input. Subgroup size typically 3-5 consecutive welds.
Individual and Moving Range (I-MR) Charts: Used when subgrouping isn’t practical—monitoring heat input per weld or individual penetration measurements.
Cumulative Sum (CUSUM) Charts: Detect small process shifts faster than traditional Shewhart charts. Critical for catching gradual electrode wear or gas flow degradation.
Western Electric Rules for Control Charts
Standard control limits (±3σ) catch major process shifts. Western Electric rules identify subtler patterns indicating special causes:
- Any point beyond ±3σ limits
- Two of three consecutive points beyond ±2σ on same side
- Four of five consecutive points beyond ±1σ on same side
- Eight consecutive points on same side of centerline
- Six consecutive points steadily increasing or decreasing
- Fifteen consecutive points within ±1σ (stratification)
When rules trigger, the welding system should automatically alert operators and optionally stop production for investigation.
Thermal Imaging for Automated Capability Monitoring
Traditional SPC in welding relies on destructive testing and offline measurement—too slow for real-time process control. Thermal imaging enables non-contact, inline monitoring that generates capability data for every single weld. This is how you get real-time SPC from inline thermal monitoring instead of after-the-fact lab measurement.
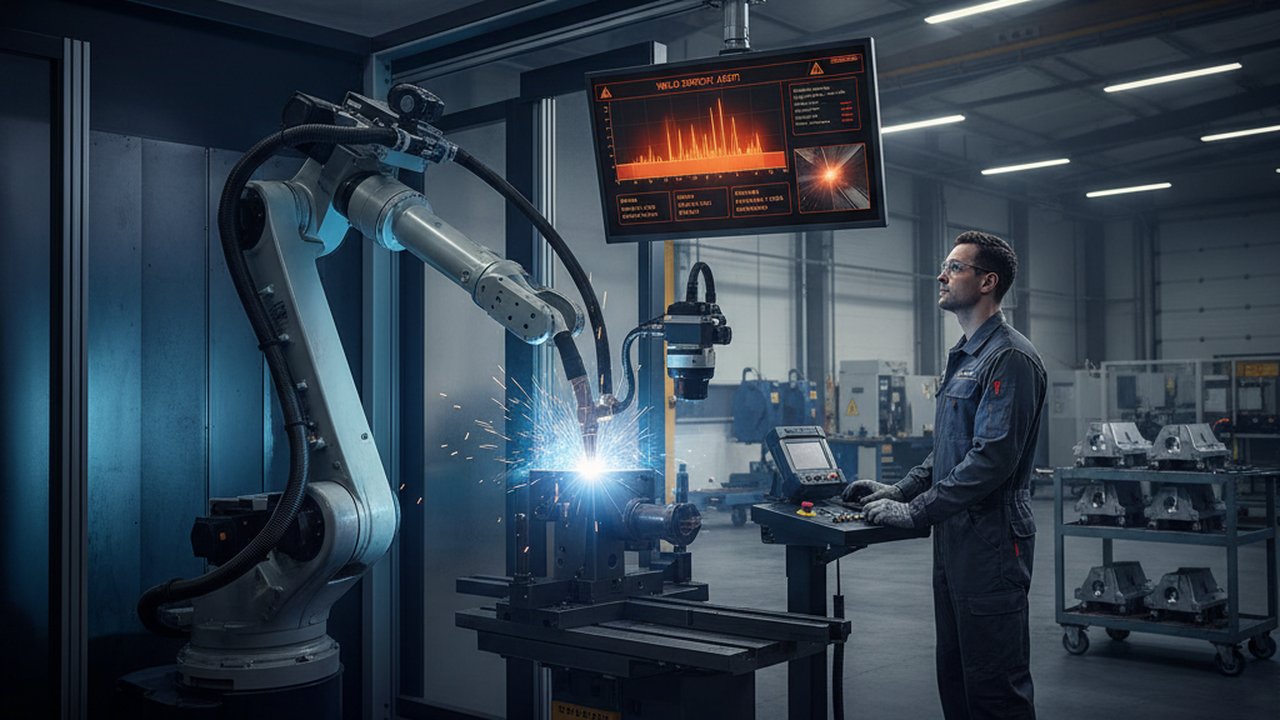
HeatCore Real-Time SPC Dashboard
The HeatCore platform continuously calculates Cpk and Ppk from thermal profile data:
- Peak temperature at specific weld locations
- Cooling rate (T8/5 for carbon equivalent calculations)
- Heat distribution uniformity across the weld seam
- Thermal gradient consistency indicating penetration stability
Each weld generates thousands of data points analyzed against specification limits. The system updates capability indices in real-time, flagging degradation before it affects part quality. Watch cooling-time (T8/5) analysis extracted from the thermal feed to see the raw signal behind these indices.
HeatCore’s AI engine automatically identifies which thermal features correlate with mechanical test results, prioritizing the parameters that truly indicate weld quality for your specific application.
Correlation with Destructive Test Results
Thermal profile capability must correlate with actual mechanical properties. Establish this relationship through initial process qualification:
- Collect thermal data from 30+ sample welds spanning parameter ranges
- Perform destructive testing (tensile, bend, macro-etch) on each sample
- Perform regression analysis identifying thermal features predicting mechanical results
- Set specification limits on thermal parameters to guarantee mechanical compliance
Once validated, inline thermal monitoring replaces much destructive testing while maintaining quality assurance.
PPAP Documentation Requirements
Production Part Approval Process submissions for welded components require specific capability documentation:
Initial Process Studies (AIAG PPAP Element 2)
Customer-designated special characteristics require capability studies with minimum 100 samples. The submission package includes:
- Histogram showing data distribution
- Normal probability plot verifying distribution assumption
- Cpk and Ppk calculations with confidence intervals
- Control charts showing process stability
- Measurement system analysis (MSA) results verifying gage capability
Control Plan (AIAG PPAP Element 5)
Your control plan must specify:
- Control method for each critical characteristic (thermal imaging, vision inspection, etc.)
- Sample size and frequency
- Reaction plan when capability deteriorates
- Statistical methods for ongoing monitoring
the HeatCore QMS workflow automates control plan generation from PFMEA inputs, ensuring consistency between risk analysis and process controls.
Achieving and Maintaining Capability
Process Improvement Roadmap
If your initial capability study shows insufficient Cpk/Ppk:
Phase 1: Reduce Variation
- Identify primary variation sources via multi-vari analysis
- Implement fixture verification to eliminate fit-up inconsistency
- Standardize welding parameters across shifts and operators
- Control environmental factors (temperature, drafts affecting shielding gas)
Phase 2: Center the Process
- Adjust nominal parameters to center the distribution between specification limits
- Implement automated parameter control rather than manual adjustment
- Use thermal feedback for real-time heat input optimization
Phase 3: Maintain Capability
- Deploy continuous monitoring with automated alerts
- Implement preventative maintenance based on capability trends
- Retrain operators when drift patterns indicate skill degradation
Common Capability Killers in Welding
| Root Cause | Impact | Detection Method | Solution |
|---|---|---|---|
| Electrode wear | Gradual parameter drift | CUSUM chart on resistance | Automatic change alerts |
| Joint fit-up variation | Penetration inconsistency | Pre-weld thermal verification | Fixture control |
| Shielding gas degradation | Porosity, oxidation | Visual inspection + gas flow monitoring | Automated gas quality checks |
| Power supply fluctuation | Heat input variation | Real-time voltage/current monitoring | Line conditioning or compensation |
| Wire feed inconsistency | Bead profile variation | Encoder feedback monitoring | Drive system maintenance |
Advanced Capability Concepts
Non-Normal Distributions
Some welding parameters (porosity counts, defect occurrence) follow Poisson or binomial distributions rather than normal. For these, use:
- Cpk equivalents for non-normal data (transformations or percentile methods)
- Attribute control charts (p-charts, c-charts) for defect counts
- Zero-inflated models when defects are rare but critical
Multivariate Capability
Weld quality depends on multiple correlated parameters simultaneously. Multivariate capability indices (MCpk, MPpk) evaluate overall process performance across all critical characteristics together, detecting issues that univariate analysis misses.
Machine learning models can establish the complex relationships between thermal signatures, process parameters, and final quality—enabling predictive capability rather than reactive measurement.
Regulatory Standards and Guidelines
Process capability requirements appear across welding quality standards:
- ISO 3834-2:2021: Requires process control and monitoring, with capability implied for comprehensive quality requirements
- AIAG SPC Manual: Defines Cpk/Ppk calculation methods for automotive suppliers
- AWS D1.1/D1.1M:2025: Specifies qualification testing establishing baseline process capability
- IATF 16949: Requires statistical concepts application including process capability
Conclusion
Welding process capability analysis transforms quality from inspection-based detection to prevention through statistical understanding. By implementing real-time SPC with automated Cpk/Ppk calculations, manufacturers achieve the predictable, documented quality that automotive OEMs and regulatory bodies demand.
The investment in capability infrastructure—thermal monitoring systems, data collection architecture, and analytical capabilities—pays dividends through reduced scrap, faster PPAP approvals, and stronger customer relationships built on demonstrated process control. See the HeatCore product family for the thermal monitoring and analytics hardware that underpins automated capability monitoring.
Automate Your SPC Dashboard
HeatCore continuously calculates Cpk and Ppk from thermal data, alerting you to process drift before defects occur. See how real-time capability monitoring transforms welding quality assurance.
Book a Capability DemoRelated Articles:
- SPC for Welding: X-bar, R, and Cpk Thermography
- PPAP Weld Traceability and Control Plan Monitoring
- Welding Digital Twin for Quality Monitoring
- Welding Data Historian MES Integration
Therness solution: Welding monitoring system — Every weld inspected in the cycle, with defect flags and the ISO 3834 / ISO 17635 evidence kept per weld.