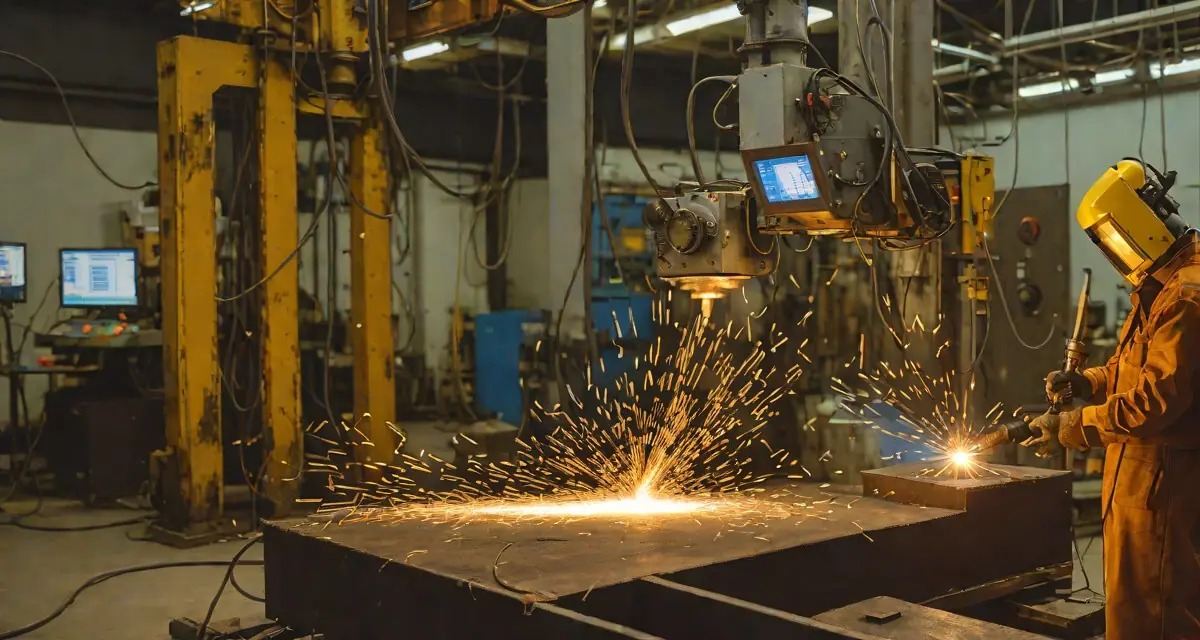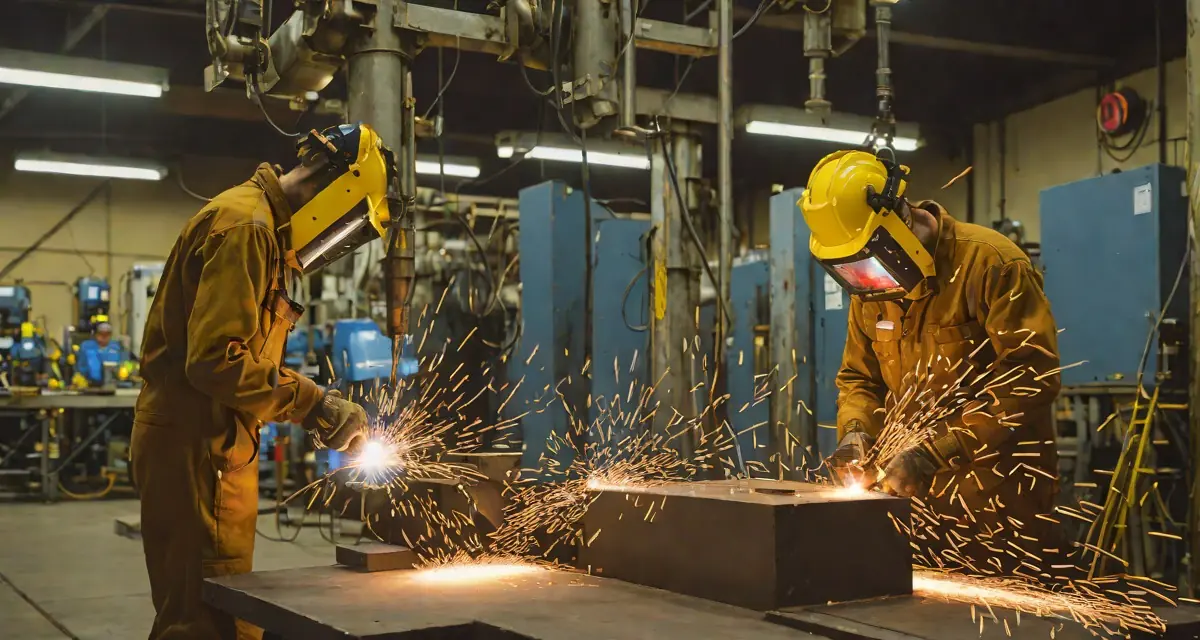
Flux-cored arc welding quality monitoring has long been a reactive discipline: visual inspection catches surface defects after the bead is cold, ultrasonic or radiographic NDT finds subsurface voids hours or days later, and by then the rework cost has already compounded. In structural steel fabrication, shipbuilding, and heavy equipment manufacturing—the core environments where FCAW dominates—an undetected lack of fusion in a load-bearing joint can trigger field failures with severe safety and liability consequences.
In these heavy-fabrication environments, pricing rework risk correctly matters as much as catching defects early — the QuoteBuddy welding cost estimation guide covers how estimators do it.
Real-time thermal imaging changes the equation. By capturing the heat signature of every weld bead as it is deposited, inline thermal sensors can flag parameter excursions, identify cooling anomalies consistent with porosity formation, and generate timestamped records that satisfy ISO 3834-2 quality management requirements. This post explains how FCAW monitoring works in practice, what defects are detectable, and how to integrate thermal inspection into an existing fabrication workflow.
Why FCAW Demands More Rigorous In-Process Monitoring
Flux-cored arc welding is the workhorse of heavy fabrication. Its high deposition rates, tolerance for outdoor conditions, and compatibility with thick carbon steel and structural sections make it the process of choice for bridge girders, offshore structures, heavy machinery frames, and shipbuilding hull panels. But the same characteristics that make FCAW productive also create quality challenges:
- Slag entrapment: The flux core generates a protective slag blanket. If travel speed is too high or the inter-pass cleaning is incomplete, slag islands can be trapped between passes—creating planar discontinuities that ultrasonic testing often struggles to characterise.
- Porosity from moisture contamination: Flux-cored electrodes absorb moisture rapidly if not stored correctly. Even a slight increase in electrode moisture produces hydrogen-rich shielding, causing wormhole porosity that only radiographic testing reliably detects.
- Lack of fusion at sidewalls: In narrow-groove joints or tight T-joints, the FCAW arc can bridge the gap without fully fusing the sidewall—especially when welding operators run excessive travel speeds or incorrect torch angles.
- Parameter drift in long welds: Structural fabrication routinely involves single beads running several metres. Wire feed speed, voltage, and contact-tip-to-work distance drift as electrode reels empty and as operator fatigue sets in. These drifts are invisible until defects appear.
In ISO 3834-2 audits, inspectors routinely cite the absence of in-process parameter records as a major non-conformance in FCAW operations. Post-weld NDT sampling alone does not satisfy the standard’s traceability requirements.
Traditional quality control relies on sampling: perhaps 10–20% of joints receive RT or UT. The rest are released on the strength of visual inspection alone. For welded structures operating under fatigue loading—cranes, offshore legs, bridge components—that sampling rate is insufficient. A real-time FCAW process monitoring system covers 100% of production, turning every bead into a traceable quality record.
How Thermal Imaging Monitors FCAW in Real Time
A thermal camera positioned at a fixed standoff from the weld zone captures the infrared emission of the molten pool, the heat-affected zone, and the solidifying bead at frame rates from 25 Hz to several hundred Hz (watch real-time arc weld monitoring in action). The resulting thermal data stream encodes process state in a physically meaningful way:
Arc Energy and Heat Input
Heat input in FCAW is governed by the relationship between current, voltage, and travel speed. A thermal imaging system measures the integrated area and peak temperature of the thermal plume above the weld pool. When voltage drops or travel speed increases—reducing effective heat input below the minimum specified in the welding procedure specification (WPS)—the thermal signature narrows and cools. This triggers an out-of-specification alert within seconds, not after inspection the following morning.
Monitoring heat input in real time is particularly valuable for multi-pass welding, where each pass must stay within a defined heat input window to control the heat-affected zone microstructure and prevent hydrogen-induced cracking.
Interpass Temperature Compliance
For medium and high-strength structural steels, the maximum interpass temperature is a critical WPS parameter. Excessive interpass temperature softens the HAZ and reduces toughness. Thermal imaging measures the surface temperature of the preceding bead at the exact moment the next arc is struck, generating an auditable interpass temperature log for every pass.
This capability complements the preheat monitoring described in ISO 13916 compliance workflows and eliminates the need for manual contact-pyrometer readings that introduce both measurement uncertainty and time delays.
Porosity Indicators via Cooling Rate Analysis
When gas bubbles are trapped in the solidifying weld pool, they disrupt the thermal conductivity of the local metal. High-speed thermal imaging can detect anomalous hot spots that persist beyond the expected solidification time—a thermal signature consistent with subsurface voids. This is not a substitute for radiographic confirmation, but it provides a real-time flag that redirects NDT effort to specific joint coordinates, reducing overall inspection time.
- Heat input excursions (high or low) vs. WPS limits
- Interpass temperature violations before the next pass
- Arc instability and wire feed irregularities via plume oscillation
- Abnormal cooling patterns consistent with slag entrapment or porosity
- Torch position drift causing asymmetric thermal profiles (indicative of sidewall fusion risk)
Weld Geometry Consistency
The width and symmetry of the thermal footprint correlates with bead geometry. A bead that is significantly narrower on one side than the other indicates torch angle deviation—a leading cause of lack-of-fusion defects at one sidewall. Real-time geometry monitoring allows operators to correct torch angle before completing the pass, rather than discovering the defect during UT.
FCAW Defect Signatures: What the Thermal Data Shows
Understanding the specific thermal signatures associated with FCAW defects is key to building reliable alarm logic in a monitoring system.
Porosity
Porosity in FCAW most often originates from:
- Moisture in the flux core (hydrogen porosity)
- Surface contamination releasing hydrocarbons into the arc
- Inadequate shielding gas coverage in FCAW-G variants, per ISO 14175:2008
The thermal indicator is a localised hot spot that persists 0.5–2 seconds longer than the surrounding solidified bead. Distributed porosity (multiple small pores) appears as a generalised elevation of post-solidification temperature along the bead centreline.
Lack of Fusion
Lack of fusion produces a distinctive thermal asymmetry: the side of the joint with incomplete fusion retains heat longer because the unfused interface acts as a thermal barrier. In groove welds monitored from above, this appears as a thermal gradient skewed to one side. In fillet welds monitored with a side-facing sensor, the cold sidewall appears as a sharp thermal discontinuity in the post-solidification period.
Lack of fusion is the most safety-critical FCAW defect and the hardest to detect by visual inspection. Real-time thermal asymmetry detection provides the only viable 100% inspection method for high-volume structural fabrication.
Slag Entrapment
Slag entrapment between passes shows as a cooler-than-expected inter-bead zone combined with a broader-than-expected thermal profile in the pass deposited over it. The insulating effect of the slag layer retards heat conduction into the underlying metal, producing a measurable thermal anomaly at the transition.
Integrating FCAW Monitoring into ISO 3834-2 Compliance Workflows
ISO 3834-2 requires manufacturers to demonstrate control over welding processes through documented inspection and testing plans. For FCAW operations, a thermal monitoring system satisfies several of the standard’s key clauses:
| ISO 3834-2 Clause | Monitoring Capability |
|---|---|
| Clause 11 – Inspection and testing before welding | Preheat verification via thermal scan |
| Clause 12 – Inspection and testing during welding | Real-time heat input, interpass temperature, arc stability |
| Clause 13 – Inspection and testing after welding | Anomaly-flagged bead map for directed NDT |
| Clause 16 – Traceability | Timestamped thermal records linked to joint IDs |
When integrated with a digital welding quality management system, these records automatically populate the welding documentation package for each joint—eliminating manual data entry and reducing the risk of record gaps during ISO 3834 certification audits.
For EN 1090-2 Execution Class 3 and 4 structures, where 100% NDT sampling is mandatory for critical joints, thermal monitoring provides a prioritisation layer: joints flagged by the thermal system are assigned to RT or UT first, while non-flagged joints may proceed through expedited visual inspection. This reduces NDT cycle time without reducing coverage.
Practical Deployment: Sensor Positioning for FCAW
Deploying thermal sensors on FCAW stations requires attention to three practical constraints:
Arc Flash and Spatter
FCAW generates significantly more spatter than TIG or laser welding. Sensor housings must be rated for the spatter environment, and protective air-purge systems or sacrificial optical windows are mandatory. The sensor should be positioned at a standoff angle of 30–45° from the weld axis to avoid direct arc flash saturation while maintaining clear sight of the heat-affected zone.
For automated FCAW on positioners or gantries, the sensor can be mounted on the welding carriage to maintain constant geometry. For manual FCAW at fixed positions, ceiling-mounted sensors covering the work table provide a practical alternative, though with reduced spatial resolution. The sensor fusion approach that combines thermal, visible-light, and acoustic emission data provides the most robust defect detection for complex joint geometries.
Emissivity Compensation
Structural steel at welding temperatures has emissivity ranging from 0.7 to 0.95 depending on surface condition and oxidation state. The monitoring system must apply emissivity compensation dynamically—especially in multi-pass applications where the bead surface transitions from shiny to oxidised between passes. Incorrect emissivity values cause systematic temperature errors of 30–80°C, which can mask interpass temperature violations.
Integration with Wire Feeder and Power Source
The most effective FCAW monitoring systems read wire feed speed, voltage, and current directly from the power source via digital interfaces (typically EtherNet/IP or Profibus). Correlating electrical parameters with thermal data in a unified timeline allows the system to distinguish thermal anomalies caused by intentional parameter changes (e.g., a welder adjusting amperage) from anomalies caused by process instability. This integration is the foundation of the welding data historian approach that enables longitudinal quality trend analysis across production runs.
ROI Case: Structural Steel Fabrication
A representative structural steel fabricator running 8 FCAW stations, producing 120 welded assemblies per month, and experiencing a 4% defect rate reaching final inspection can estimate the impact of in-process thermal monitoring as follows:
- Rework avoidance: Each defective joint caught in-process vs. post-NDT saves 2–6 hours of rework labour plus re-inspection cost
- NDT reduction: Directed NDT based on thermal flags reduces UT/RT coverage by 30–40% while maintaining or improving defect detection rate
- Scrap reduction: Parameter drift caught within seconds prevents full-length bead rejection
- Audit efficiency: Automated documentation reduces ISO 3834 audit preparation from days to hours
For a detailed ROI model specific to your operation, the weld quality ROI calculator provides a structured framework with industry-benchmarked cost inputs.
Standards and Specifications Governing FCAW Quality
A complete FCAW quality monitoring programme should reference the following standards:
- ISO 3834-2:2021 — Quality requirements for fusion welding; the primary compliance framework for structural and pressure equipment fabricators
- ISO 5817:2023 — Weld quality levels for arc-welded joints in steel; defines acceptance criteria that thermal anomaly thresholds should be calibrated against
- AWS D1.1/D1.1M:2025 — Structural Welding Code—Steel; the governing specification for structural FCAW in North American markets
- ISO 14175:2008 — Welding consumables: gases and gas mixtures for FCAW-G shielding
Welding procedure specifications for FCAW should explicitly define the heat input range, preheat and interpass temperature limits, and inter-pass cleaning requirements that the monitoring system will enforce. Deviations captured by the thermal system generate non-conformance records linked directly to the WPS reference, supporting welding NCR management workflows and closed-loop CAPA.
Conclusion
Flux-cored arc welding quality monitoring is evolving from post-weld sampling to continuous, in-process thermal inspection. The technology is mature, the integration pathways to ISO 3834-2 documentation are well-defined, and the ROI case is compelling for any fabricator where rework, NDT cost, or audit compliance is a significant operational burden.
The practical barrier is not the technology—it is the transition from a culture of reactive inspection to proactive process control. Thermal monitoring systems provide the data infrastructure for that transition: every bead flagged, every parameter excursion timestamped, every joint documented before the next one begins. The HeatCore monitoring systems package that infrastructure for FCAW cells across structural and heavy fabrication.
For operations running FCAW on structural sections, pressure vessels, or heavy equipment frames, the question is no longer whether to monitor—it is how quickly to deploy.
See HeatCore Monitoring on FCAW Stations
Book a 30-minute technical demo to see how HeatCore's real-time thermal monitoring integrates with your FCAW welding cells, power sources, and ISO 3834-2 documentation workflow.
Book a demoTherness solution: Welding camera — Thermal and high-speed imaging that watches the arc, the pool and the cooling seam while the weld is made.