Comparing weld thermal signatures turns “which weld is better” into something you can actually measure
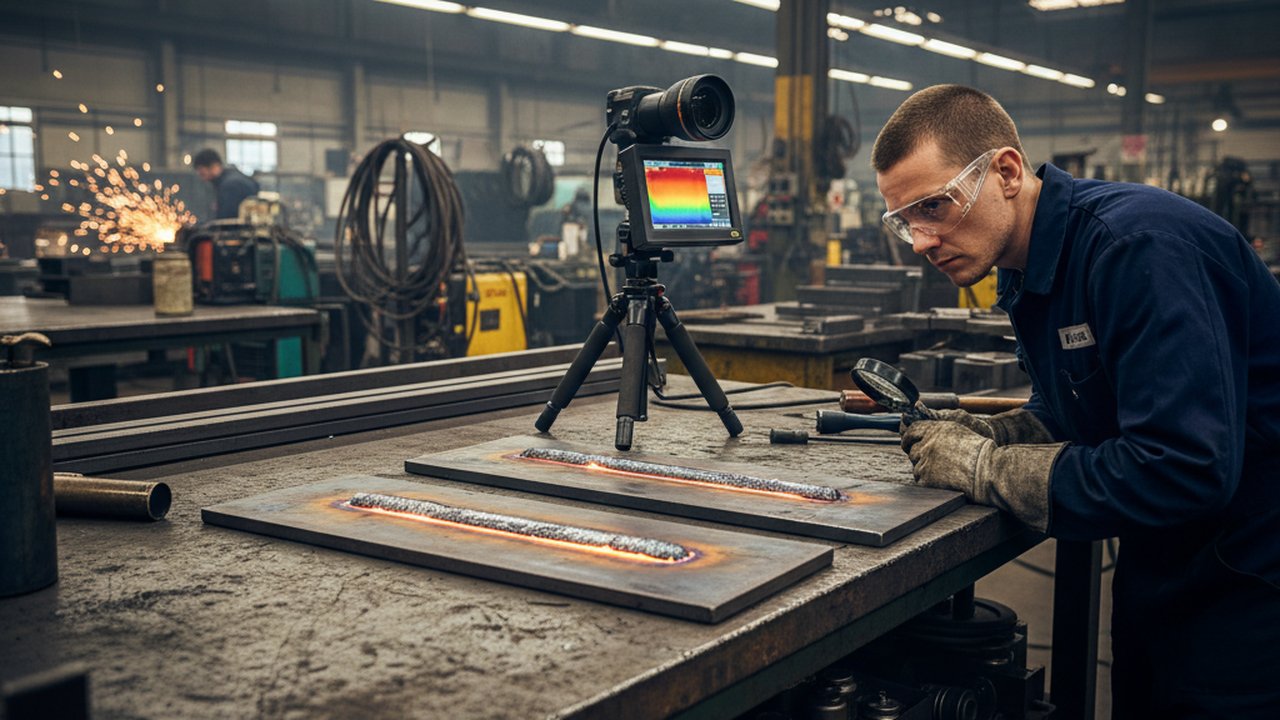
Comparing weld thermal signatures side by side is the fastest way to make an invisible difference visible: put two beads in the same infrared frame and the way heat moved through each joint stops being a guess. A visual inspection of two finished, cooled, and often cleaned welds tells you almost nothing about how the energy that made them actually behaved. A thermal comparison, taken while both were still hot, shows the trailing plume shape, the peak temperature, and the cooling behaviour each joint produced — and those three signals correlate with penetration, fusion, and microstructure far more directly than surface appearance ever will.
Key takeaways
- A longer, even trailing plume usually means heat conducted smoothly into the base metal — a sign of full fusion.
- A short, hot, lopsided plume usually means energy stayed near the surface instead of penetrating — a sign of lack of fusion or a cold, sat-on-top bead.
- Cooling rate matters as much as peak temperature: it governs hardness and toughness in the heat-affected zone.
- Asymmetry is a prompt to investigate, not an automatic defect call — fit-up, torch angle, and drafts all distort a signature too.
- A comparison is only as good as its reference: you need a known-good baseline recorded under matching conditions.
- Same current and voltage does not guarantee the same thermal signature — travel speed, contamination, and geometry all move it.
- Thermal comparison ranks which welds deserve the destructive or NDT check first; it does not replace that check.
How heat distribution becomes a comparable signature
What the camera is actually measuring
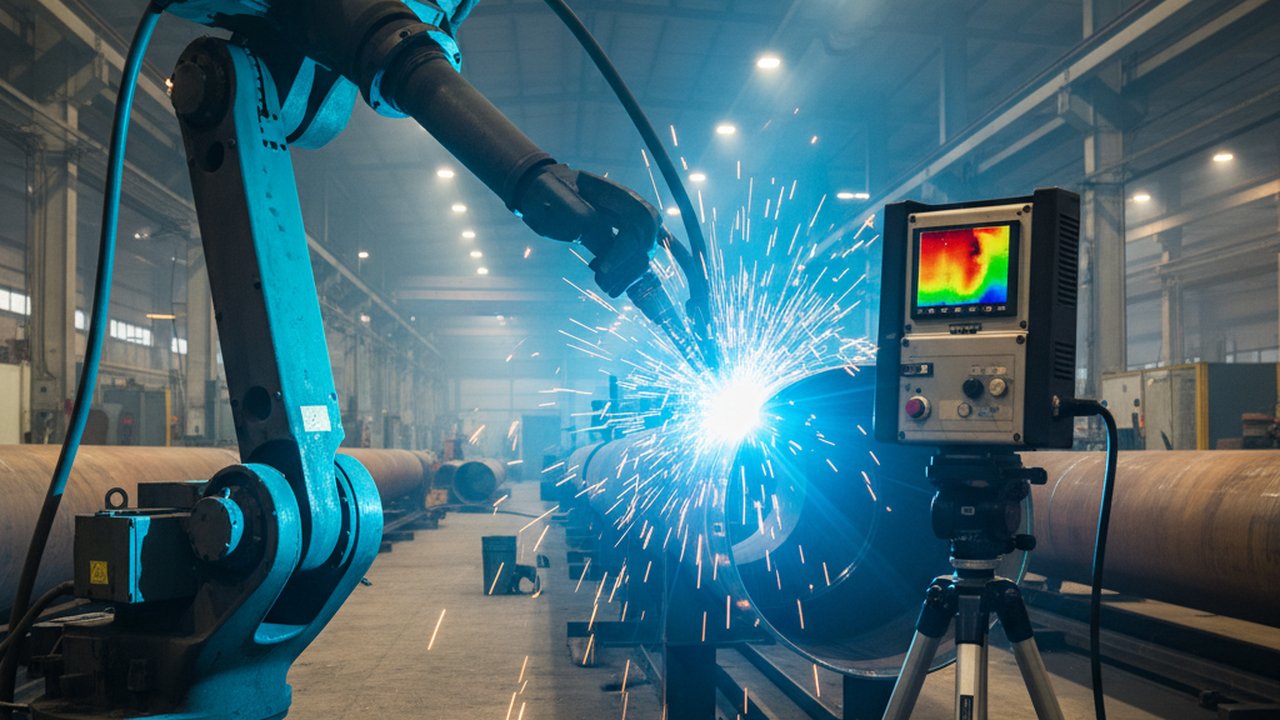
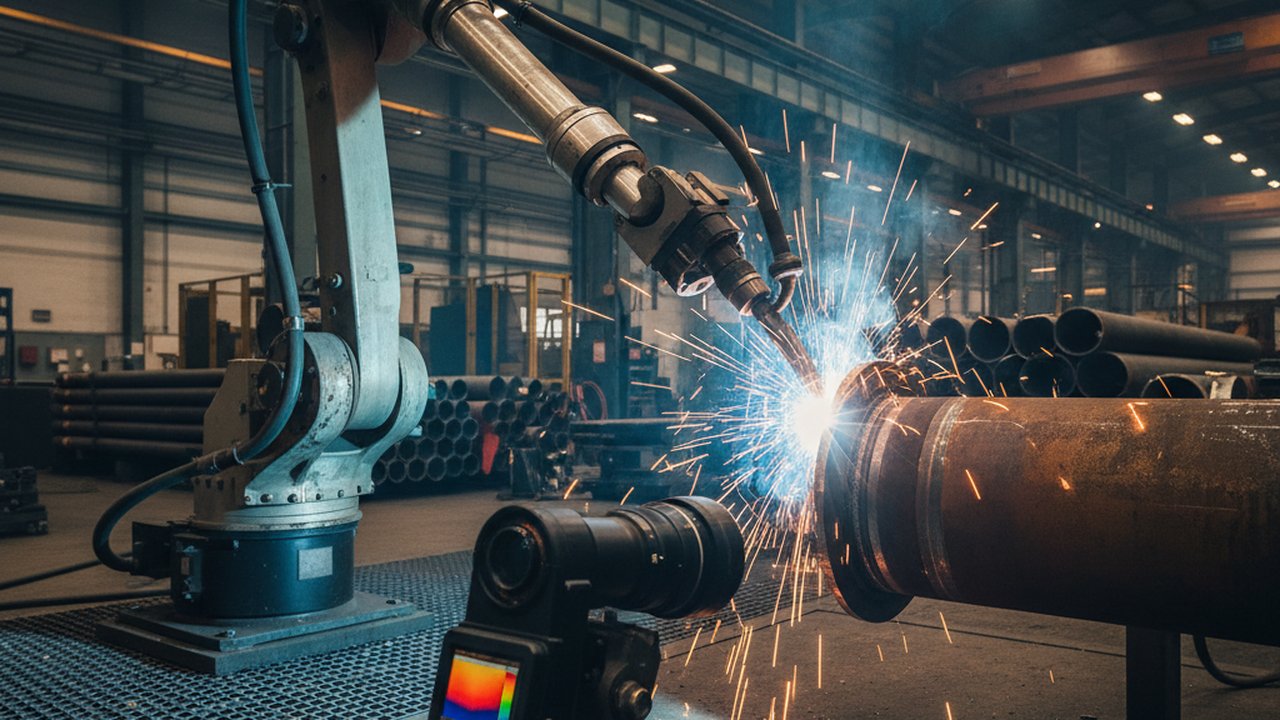
A thermal camera records infrared radiation and converts it to temperature, frame by frame, so a side-by-side comparison of two welds is a comparison of two continuous temperature fields, not two pictures. The physics behind that conversion is the same Stefan–Boltzmann relationship between radiated power and temperature that underlies all radiation thermometry (reference on Wikipedia), and it depends on emissivity being set correctly for the surface in front of the lens — a value that changes with oxidation, alloy, and surface finish, as the Engineering Toolbox emissivity reference table shows across dozens of common materials.
Why the trailing plume carries most of the information
The region just behind the arc — the trailing plume — is where the comparison actually happens, because the arc itself saturates the sensor with glare and carries no usable temperature data. An even, elongated plume means heat is conducting into the base metal at a steady rate: the signature of a pool that wet in and fused properly. A short, hot, asymmetric plume means energy piled up near the surface instead of spreading — the thermal fingerprint of lack of fusion or a bead that sat on top of the joint rather than into it. The NDE-ED chapter on interpreting infrared imagery covers this kind of pattern reading in more general NDT contexts.

The clip above is the reference for this article — two welds side by side, one with the even, well-fused signature, one showing the shorter, hotter, lopsided pattern. The source page, with its transcript and product context, is thermal imaging comparison of two welds.
Reading a comparison correctly: what each pattern means
The strong-weld pattern
Even, elongated, symmetric about the joint centreline, with a trailing plume that fades gradually rather than dropping sharply. This is consistent with full fusion and a controlled cooling rate — the kind of pattern that also tends to correlate with a T8/5 cooling interval inside the target window described in our guide to heat input and cooling rate.
The weak-weld pattern
Short, hot, and lopsided, with the plume collapsing quickly rather than fading gradually. This pattern is consistent with lack of fusion — energy that never reached the parent metal — or with lack of penetration at the root, where the joint geometry itself limited how deep the arc could reach.
The over-energy pattern
Wide, very hot, and slow to narrow, sometimes with the plume widening further after the arc has passed. This is the signature that precedes burn-through: more energy arriving than the joint can carry away.
None of these three patterns is a numeric pass/fail line — that judgment belongs to the acceptance criteria in the governing standard, such as ISO 5817 for fusion-welded steel, nickel, titanium and their alloys. A thermal comparison tells you where to look; the standard tells you what “acceptable” means there.
Comparing two welds correctly: step by step
- Record a reference pass first. Weld a known-good sample on the exact material, thickness, joint type, and process you intend to compare against, with the camera in the position it will use for production.
- Fix the camera geometry. Same standoff distance, same angle, same field of view for every weld you intend to compare — a different viewing angle changes the apparent plume shape independent of anything happening in the joint.
- Set emissivity once, deliberately. Use a contact reference measurement on the actual surface condition, and keep that setting fixed for the whole comparison set; changing it mid-series invalidates the comparison.
- Weld the test pass and the comparison pass back to back. Minimising the time between them controls for drift in ambient conditions, torch wear, and material temperature.
- Overlay or place the two clips side by side, matched on the same point in the weld cycle (arc start, mid-bead, arc stop) rather than on elapsed time alone, since travel speed differences shift the timeline.
- Note where the patterns diverge, not just whether they differ — a difference only at the start suggests a fit-up or start-technique issue; a difference throughout suggests a parameter or contamination issue.
- Route anything that diverges from baseline to confirmation. Log which welds need a destructive cut or NDT check based on how far they sit from the reference signature, then verify.
A real-time weld monitoring system built on a camera such as HeatCam IR-S keeps this reference-and-compare workflow running continuously rather than as a one-off demonstration.
Failure modes and fixes
| Symptom | Likely cause | Fix |
|---|---|---|
| Two good welds look different in thermal footage | Different camera angle or standoff between the two clips | Fix camera geometry before recording either weld |
| Comparison looks fine but a weld still fails NDT | The camera’s field of view did not cover the defect location (root, second side) | Add or reposition a camera to cover the pass that actually failed |
| Signature drifts across a shift with no process change | Ambient draft, sensor warm-up, or a slow contamination build-up on the lens | Re-baseline at shift start and check lens condition |
| Every weld reads “asymmetric” against the reference | Reference pass itself was not representative (rushed, atypical fit-up) | Re-record a reference pass under normal working conditions |
| Emissivity looks right on steel but wrong after a material change | Emissivity was carried over from the previous material | Recheck emissivity against a contact reference for the new material |
| Operators distrust the comparison after one false flag | Threshold set from a single reference weld rather than a normal spread | Build the baseline from several known-good welds, not one |
Verifying the comparison against ground truth
Correlate with a destructive or NDT check
The comparison is a ranking tool, not the acceptance test itself. During procedure qualification, and periodically afterward, cut or NDT-check both the reference weld and at least one weld that diverged from it, and confirm the thermal difference actually corresponds to a real metallurgical or geometric difference. ISO 6520-1 gives the shared vocabulary for naming what that check finds, and ISO 5817 sets the quality levels the finding gets judged against. A certified NDT technician runs and signs off that confirming test — the thermal comparison only decides which weld reaches their bench first.
Keep the comparison auditable
Store the reference clip, the camera settings used, and the emissivity value alongside every comparison you make a decision from. A customer or auditor evaluating conformance to a structural code such as AWS D1.1 will ask for the pairing between the thermal read and the confirming test, not the thermal read alone — the nondestructive-examination method it points to is what actually satisfies that requirement.
Decision checklist: is this comparison trustworthy?
- Both welds recorded with the same camera position, angle, and standoff.
- Emissivity set from a contact reference on the actual surface, not a default value.
- A known-good reference pass exists for this exact material, thickness, and process.
- The reference itself was built from more than one weld, not a single lucky pass.
- Divergence from baseline is logged against a specific location (start, mid-bead, root, cap), not just “different.”
- Any weld diverging beyond the normal spread is routed to a destructive or NDT check.
- The confirming test result is recorded alongside the thermal comparison that flagged it.
If any box is unchecked, the comparison can still guide attention, but it cannot yet stand on its own as quality evidence — see thermography as NDT evidence for how a thermal record earns that status. Operators recording live comparisons should also carry the basic hazard awareness covered in OSHA’s welding, cutting and brazing topic page. For the mechanism behind a single weld’s thermal signature rather than a side-by-side comparison, see why weld defects appear first in real-time infrared video, and for the visual-versus-thermal question generally, welding camera vs. thermal camera.
FAQ
What makes one weld’s thermal trailing plume longer than another’s? More heat conducting smoothly into the base metal rather than sitting at the surface. A longer, even plume behind the pool usually means the joint wet in and fused to depth; a short, hotter plume means energy stayed near the surface instead of penetrating.
Can two welds with the same current and voltage still show different thermal signatures? Yes. Current and voltage are only two of the variables. Travel speed, torch angle, fit-up gap, contamination, and even ambient draft all change how heat actually moves through the joint, and the thermal signature reflects the outcome, not just the setpoints.
How do you compare thermal signatures across welds made by different welders? Against a shared reference pass recorded on the same material, joint type, and camera setup, not against each other directly. Without a common baseline, a real skill difference and a camera or setup difference look identical in the footage.
Does an asymmetric heat pattern always mean a defective weld? No. It means the heat did not distribute the way the reference pass did, which can come from a joint fit-up gap, an off-centre torch, or a genuine defect. Asymmetry is a prompt to look closer, not a standalone acceptance or rejection criterion.
What baseline do you need before comparing thermal signatures between production lots? A recorded reference pass on a known-good weld for that exact material, thickness, and process, taken with the same camera position and emissivity setting. Comparing today’s weld to a different setup’s footage measures the setup difference, not the weld.
Is a real-time thermal comparison enough to skip a destructive cross-section check? No. It tells you which welds are worth cutting first by ranking them against the reference signature; it does not replace the destructive or NDT method a procedure or specification actually requires for acceptance.
How many welds do you need to record before a thermal signature comparison is meaningful? Enough to see the normal spread of a known-good process, not just one lucky pass. A handful of reference welds under stable conditions shows the natural variation; comparing a new weld to a single sample confuses noise with a real difference.
Why do two visually identical welds show different cooling rates in infrared? Because cooling rate depends on heat input, preheat, interpass temperature, and the mass of surrounding material — none of which a finished, ground, or painted surface shows. Two welds can look the same and still have taken very different thermal paths to get there.
Put your own welds side by side
Tell us the material and joint type where 'which one is stronger' keeps coming up as a judgment call. We will show what a reference-and-compare thermal setup looks like on your process.
Talk to us about comparing welds by thermal signatureTherness solution: Welding camera — Thermal and high-speed imaging that watches the arc, the pool and the cooling seam while the weld is made.
Frequently Asked Questions
What makes one weld's thermal trailing plume longer than another's?
More heat conducting smoothly into the base metal rather than sitting at the surface. A longer, even plume behind the pool usually means the joint wet in and fused to depth; a short, hotter plume means energy stayed near the surface instead of penetrating.
Can two welds with the same current and voltage still show different thermal signatures?
Yes. Current and voltage are only two of the variables. Travel speed, torch angle, fit-up gap, contamination, and even ambient draft all change how heat actually moves through the joint, and the thermal signature reflects the outcome, not just the setpoints.
How do you compare thermal signatures across welds made by different welders?
Against a shared reference pass recorded on the same material, joint type, and camera setup, not against each other directly. Without a common baseline, a real skill difference and a camera or setup difference look identical in the footage.
Does an asymmetric heat pattern always mean a defective weld?
No. It means the heat did not distribute the way the reference pass did, which can come from a joint fit-up gap, an off-centre torch, or a genuine defect. Asymmetry is a prompt to look closer, not a standalone acceptance or rejection criterion.
What baseline do you need before comparing thermal signatures between production lots?
A recorded reference pass on a known-good weld for that exact material, thickness, and process, taken with the same camera position and emissivity setting. Comparing today's weld to a different setup's footage measures the setup difference, not the weld.
Is a real-time thermal comparison enough to skip a destructive cross-section check?
No. It tells you which welds are worth cutting first by ranking them against the reference signature; it does not replace the destructive or NDT method a procedure or specification actually requires for acceptance.
How many welds do you need to record before a thermal signature comparison is meaningful?
Enough to see the normal spread of a known-good process, not just one lucky pass. A handful of reference welds under stable conditions shows the natural variation; comparing a new weld to a single sample confuses noise with a real difference.
Why do two visually identical welds show different cooling rates in infrared?
Because cooling rate depends on heat input, preheat, interpass temperature, and the mass of surrounding material — none of which a finished, ground, or painted surface shows. Two welds can look the same and still have taken very different thermal paths to get there.
Related Video